These are a few simple tools that can be helpful with dealing spatial-temporal aware datasets in particular from the xarray package. These xr.Datasets are in the format (lat x lon x time x variable) and many times we just need X and y. There are a few useful functions in here that will help getting coverting that data into useful arrays for processing.
DataStructures
Xarray
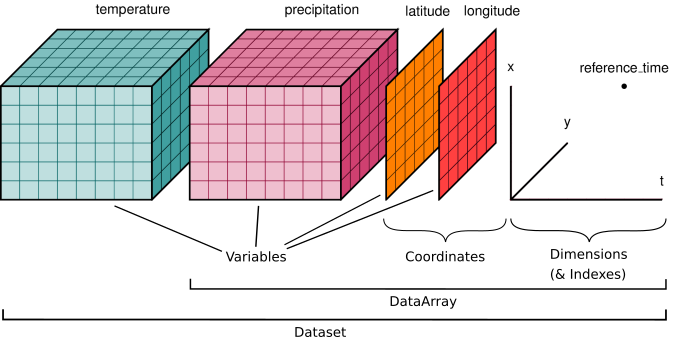
Source: Xarray Data Structure documentation
This image says a lot: is the default package for handling spatial-temporal-variable datasets. This alone has helped me contain data where I care about the meta-data as well. Numpy Arrays are great but they are limited in their retention of meta-data. In addition, it has many features that allow you to work with it from a numpy array perspective and even better from a pandas perspective. It makes the whole ordeal a lot easier.
GeoPandas
If you don’t work with arrays and you prefer to use shapefiles, then I suggest using GeoPandas to store this data. In the end, it is exactly like Pandas but it has some special routines that cater to working with Earth Sci data. I am no expert and I have really only used the plotting routines and the shape extract routines. But in the end, as a data structure, this would be an easy go to with a relatively low learning curve if you’re already familiar with Pandas.
Manipulating ShapeFiles
Some additional functionality for having specialized regions.
The original library which allows one parse shapefiles in an efficient way.
The package used to do the tranformation of the polygons to the lat,lon coordinates.
Very powerful python package that is really good at transforming the coordinates of your datasets. See Gonzalo’s tutorial for a more specific usecase.
Operations
Uncertainties - Error propagation
Visualization
Built-In
These are packages where the routine is built-in as a side option and not a fully-fledged packaged dedicated to this. Not saying that the built-in functionality isn’t extensive, but typically it might use another framework to do some simple routines.
The xarray docs have a few examples for how one can plot.
This package handles polygons and I have found that it’s really good for plotting polygons out-of-the-box.
A package that handles all of the projections needed for better visualizations of the globe. Works well with matplotlib, geopandas, and xarray.
??? info “Tutorials” * Maps in Scientific Python > A great tutorial by Rabernat
Dedicated Plotting Libraries
This is the first of the packages on this list that starts to utilize javascript under the hood. This one is particularly nice for things to do with maps and polygons.
A nice package that offers a higher level API to the Bokeh library. It allows you do do quite a lot of interactive plots. They have some tutorials for geographic data whether it be polygons or gridded data.
This has been recommended for large scale datasets with millions of points! They have some tutorials for polygons and xarray grids.