For this first experiment, we are looking at the Spain continent.
Block Maxima
Figure 1: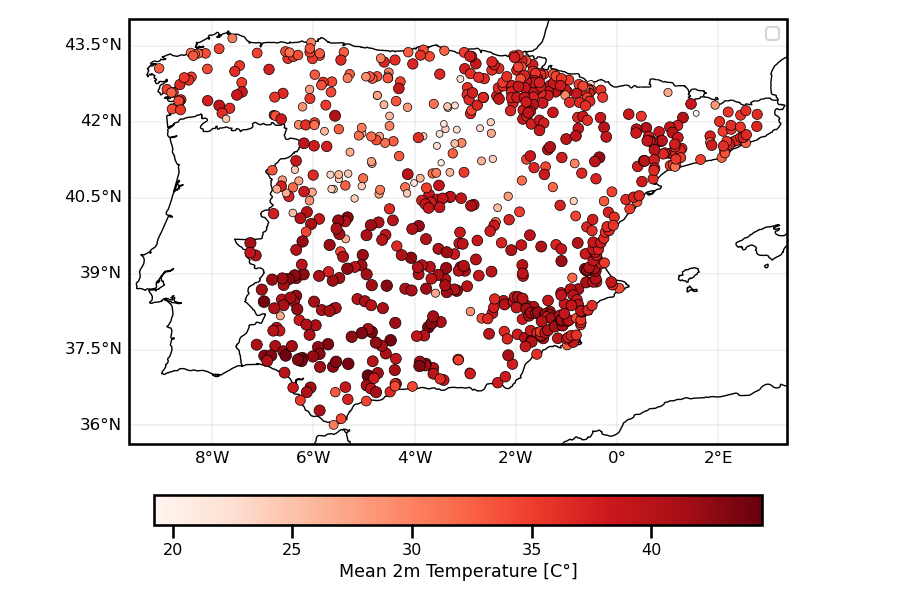 A spatial map showing the mean 2m max temperature for each station in mainland Spain.
Figure 2: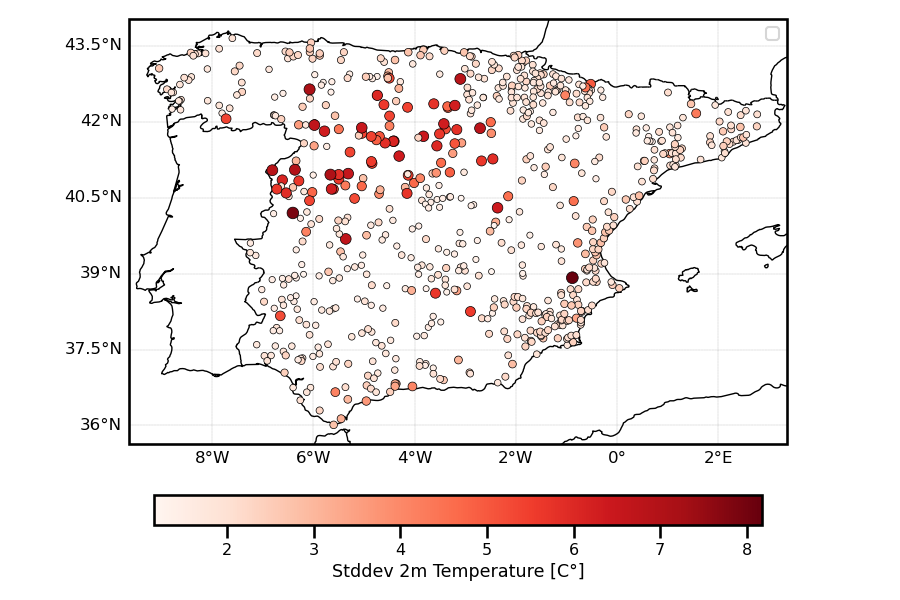 A spatial map showing the standard deviation 2m max temperature for each station in mainland Spain.
Figure 3: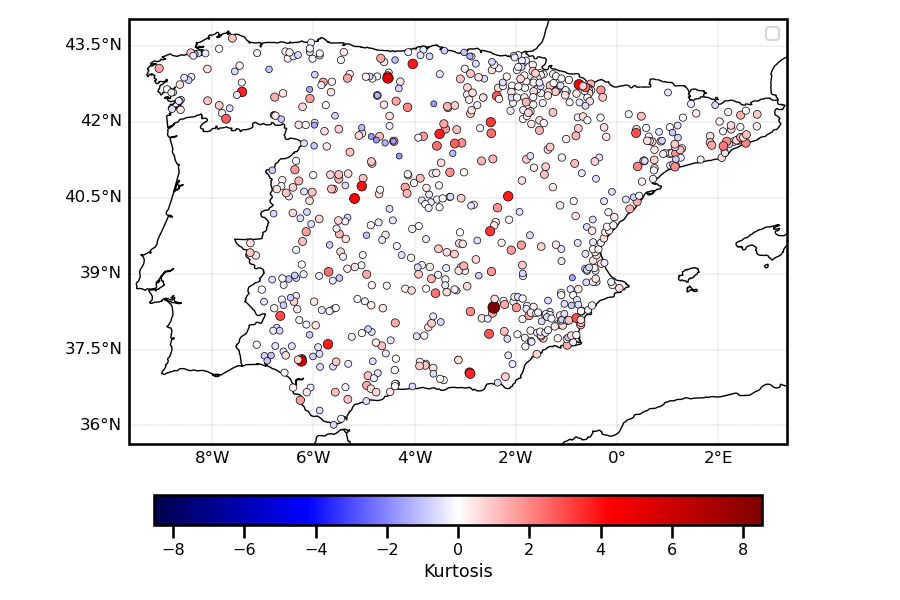 A spatial map showing the kurtosis 2m max temperature for each station in mainland Spain.
Figure 4: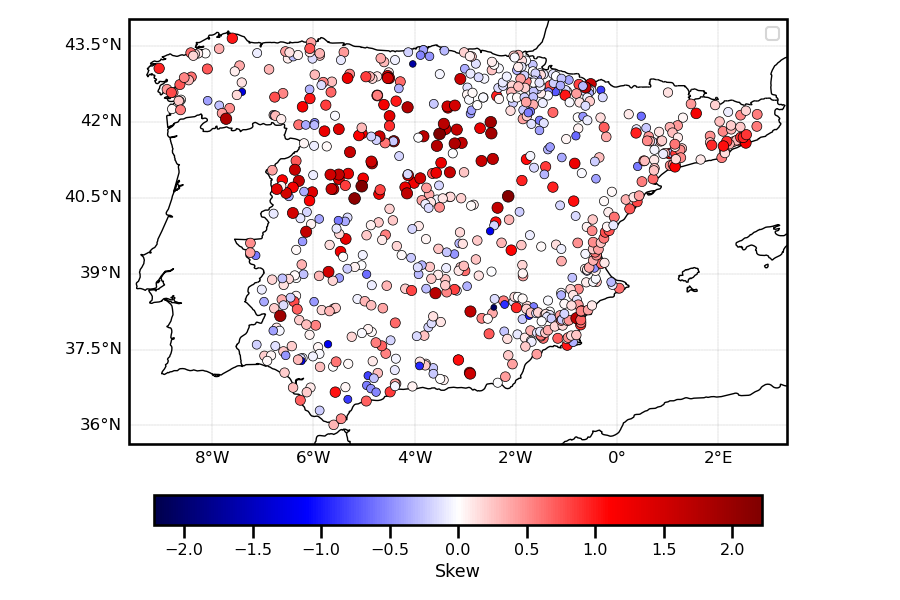 A spatial map showing the kurtosis 2m max temperature for each station in mainland Spain.
Peak-Over-Threshold
In this case, we are using the POT method. We used the 95% quantile to select the threshold. We decluster the data by 3 days, i.e., we select the maximum event within a moving 3 day blocks (no overlaps).
Figure 5: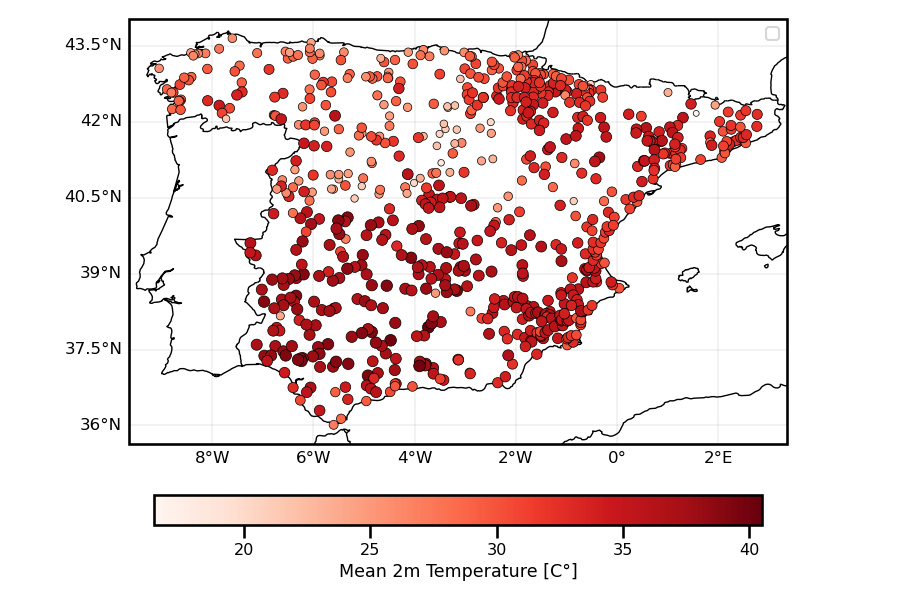 A spatial map showing the 95% threshold for the 2m max temperature for each station in mainland Spain.
Figure 5: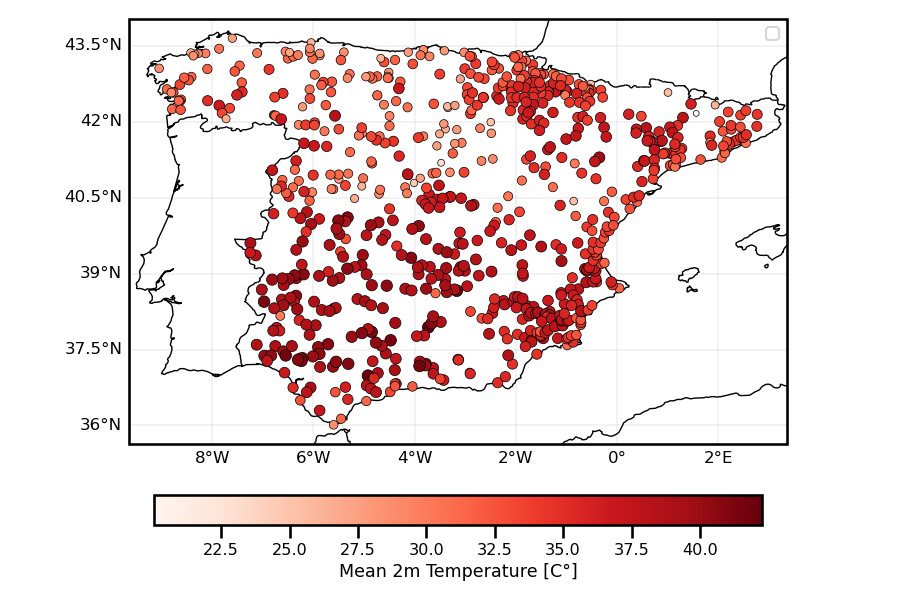 A spatial map showing the mean 2m max temperature for each station in mainland Spain.
Figure 7: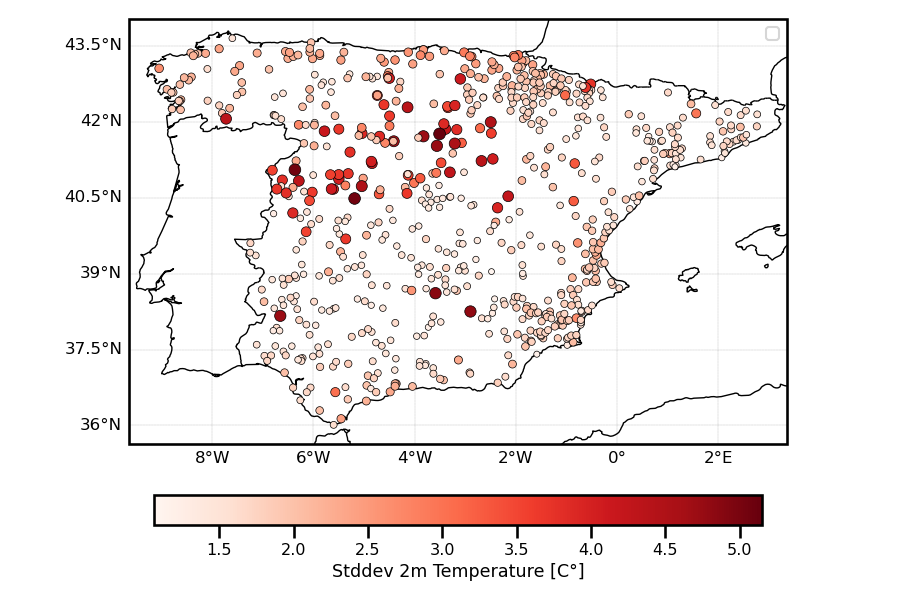 A spatial map showing the standard deviation 2m max temperature for each station in mainland Spain.
Figure 8: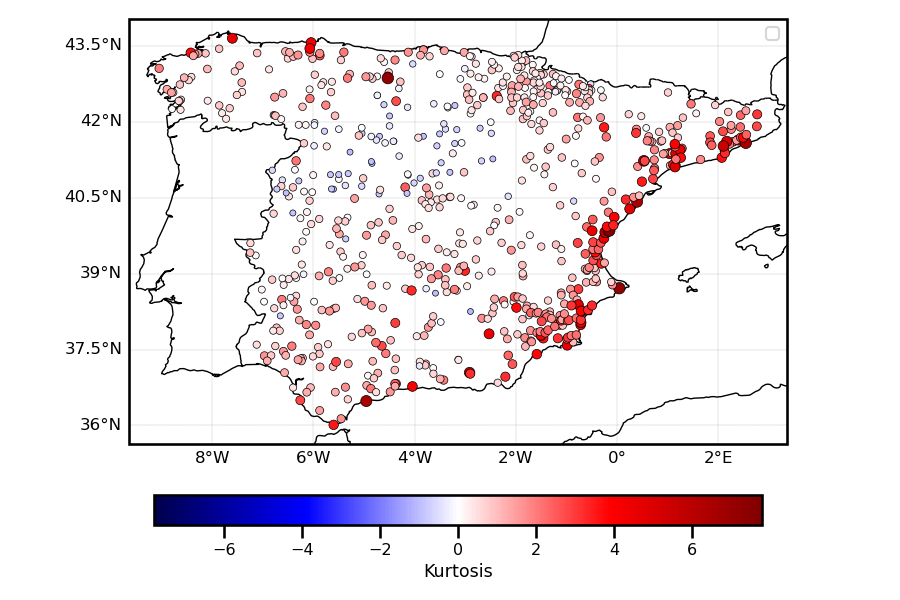 A spatial map showing the kurtosis 2m max temperature for each station in mainland Spain.
Figure 9: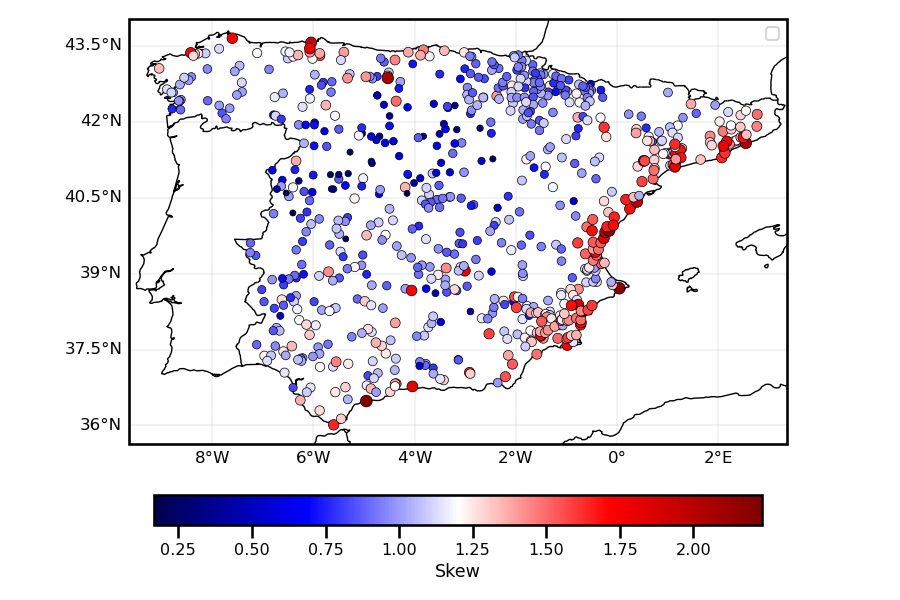 A spatial map showing the kurtosis 2m max temperature for each station in mainland Spain.
Point Process
In this case, we are using the PP method. We used the 95% quantile to select the threshold. We decluster the data by 3 days, i.e., we select the maximum event within a moving 3 day blocks (no overlaps).
Figure 5: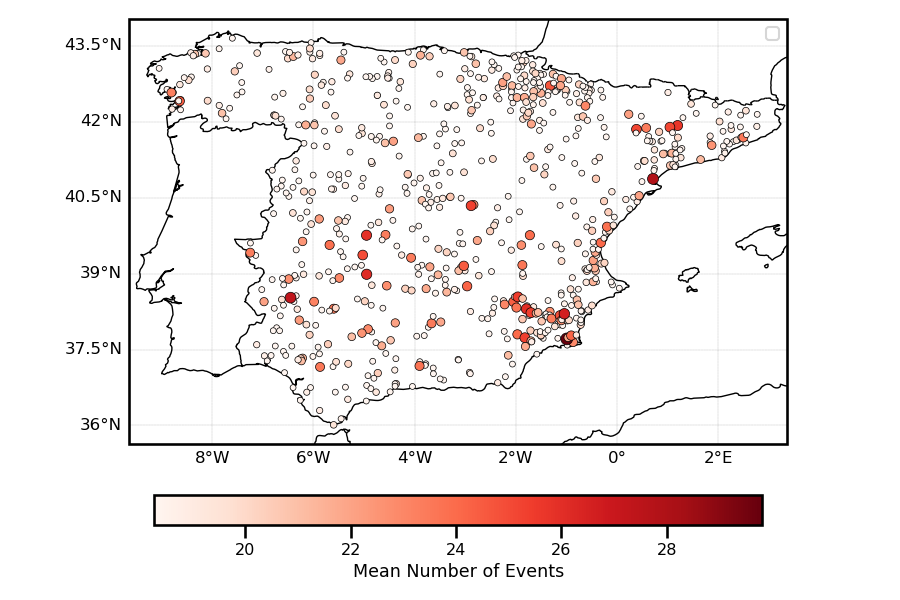 A spatial map showing the mean 2m max temperature for each station in mainland Spain.
Figure 7: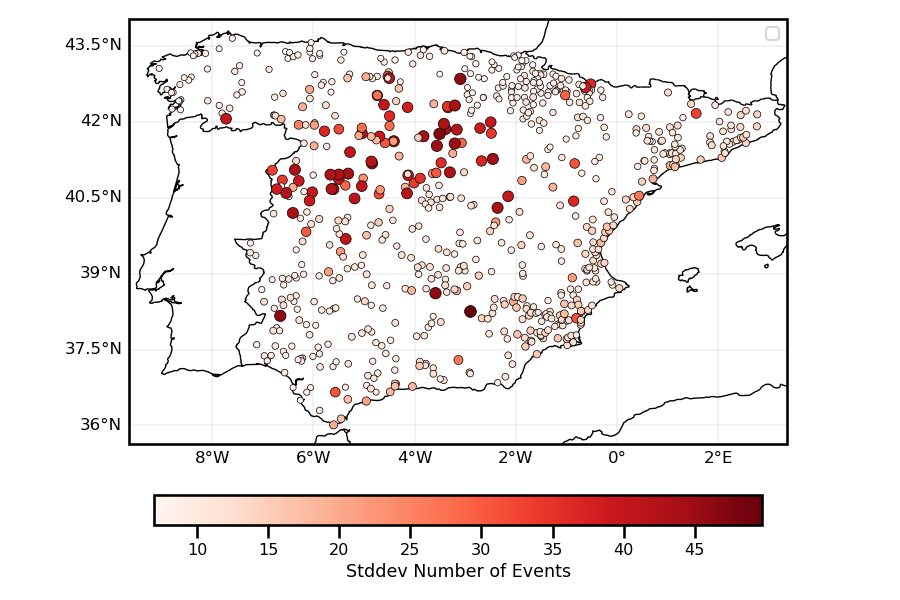 A spatial map showing the standard deviation 2m max temperature for each station in mainland Spain.
Figure 8: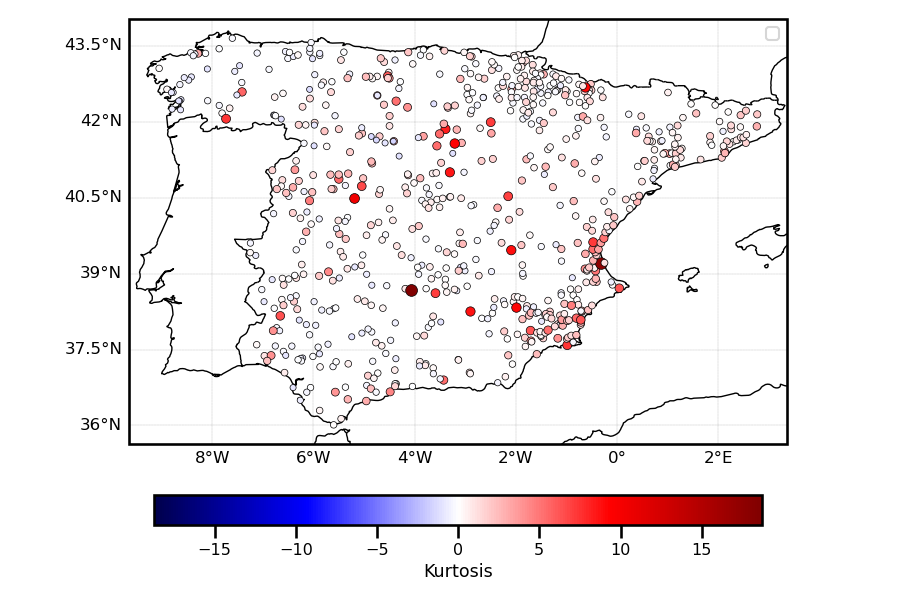 A spatial map showing the kurtosis 2m max temperature for each station in mainland Spain.
Figure 9: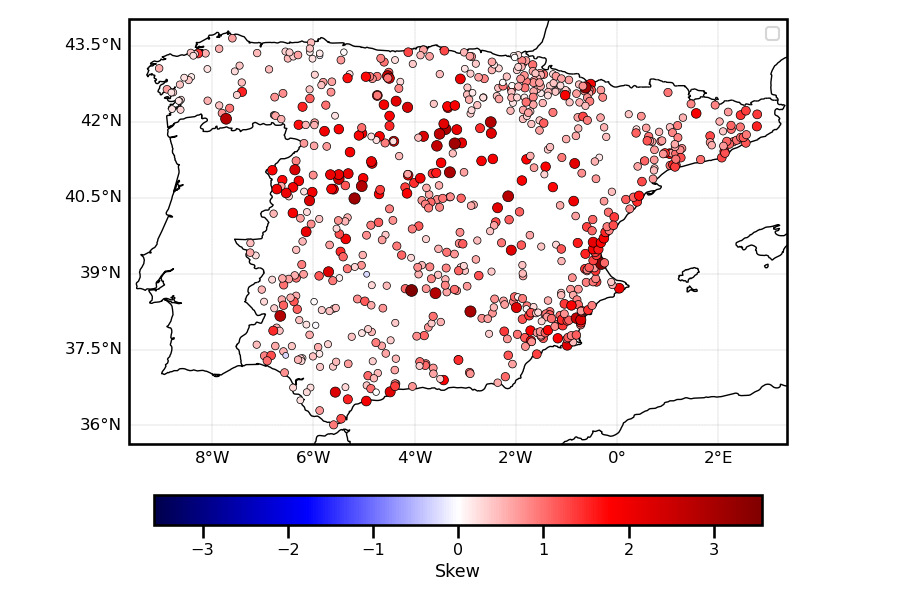 A spatial map showing the kurtosis 2m max temperature for each station in mainland Spain.