Abstract
The block-maxima method reduces a long record to the maximum of each block —
the hottest day per week, month, season or year. This notebook is a hands-on
look at that operation on real Iberian station data: we extract maxima at
several block lengths with xtremax, compare the resulting series and
histograms, and see how block length trades the number of maxima against how
extreme and how regular they are. No distribution is fitted yet — that
comes next; here we just build intuition for the data.
From daily series to block maxima
A station gives us thousands of daily values, but we care about the rare hot extremes. The block-maxima method is the first, simplest reduction: split the record into equal blocks and keep only the maximum of each. This notebook explores that operation — purely as data — at several block lengths.
Background
For a block of daily maxima , the block maximum is just
The only real choice is the block length. A short block (a week) yields many
maxima, each only mildly extreme; a long block (a year) yields few maxima, each
genuinely rare. The block length also controls how identically distributed the
maxima are — short blocks straddle the seasonal cycle, long ones absorb it. We
make both effects concrete below, using
xtremax.extraction.temporal_block_maxima.
Setup
import sys
import pathlib

try:
    import spatial_extremes  # noqa: F401  already importable (e.g. on PYTHONPATH)
except ModuleNotFoundError:
    _here = pathlib.Path.cwd().resolve()
    _roots = (_here, *_here.parents)
    _cands = [r / "_helpers" for r in _roots]
    _cands += [r / "docs" / "tutorials" / "spatial_extremes" / "_helpers" for r in _roots]
    _src = next((c for c in _cands if (c / "spatial_extremes").exists()), None)
    if _src is None:
        raise RuntimeError("cannot locate docs/tutorials/spatial_extremes/_helpers") from None
    sys.path.insert(0, str(_src))
from __future__ import annotations
import warnings
warnings.filterwarnings("ignore", message=r".*IProgress.*")
import numpy as np
import pandas as pd
import matplotlib.pyplot as plt
import seaborn as sns
sns.set_theme(style="whitegrid", context="notebook", palette="deep")
from spatial_extremes import data
from spatial_extremes.places import country_from_id, station_label
from spatial_extremes.viz import iberia_axes, scatter_field, mark_points, mark_star
from xtremax.extraction import temporal_block_maxima
df, is_real = data.load_station_daily()
da = data.to_station_time_dataarray(df) # daily-max cube, dims (station, time)
yr = da["time"].dt.year.values
print("source:", "REAL CDS" if is_real else "synthetic fallback")
print(f"daily cube: {dict(da.sizes)} | {yr.min()}–{yr.max()}")source: REAL CDS
daily cube: {'station': 198, 'time': 46182} | 1896–2026
The station network
Before reducing anything, a quick look at coverage: real networks are ragged, so we note how many stations carry long, complete records. The map colours each station by the number of years for which it has a usable annual maximum.
annual = temporal_block_maxima(da, freq="YE", time_dim="time", min_periods=300)
annual = annual.dropna("time", how="all")
n_station, n_year = annual.sizes["station"], annual.sizes["time"]
valid_years = annual.notnull().sum("time")
print(f"annual-maxima cube: {n_station} stations × {n_year} years")
for k in (26, 20, 15, 10):
    print(f"  stations with >= {k:>2} valid years: {int((valid_years >= k).sum())}")
annual-maxima cube: 198 stations × 125 years
stations with >= 26 valid years: 102
stations with >= 20 valid years: 107
stations with >= 15 valid years: 166
stations with >= 10 valid years: 185
ax = iberia_axes(figsize=(8, 7))
scatter_field(ax, annual["lon"].values, annual["lat"].values, valid_years.values,
              label=f"valid years ({yr.min()}–{yr.max()})", cmap="viridis", s=30)
ax.set_title("Station network, coloured by record length")
plt.show()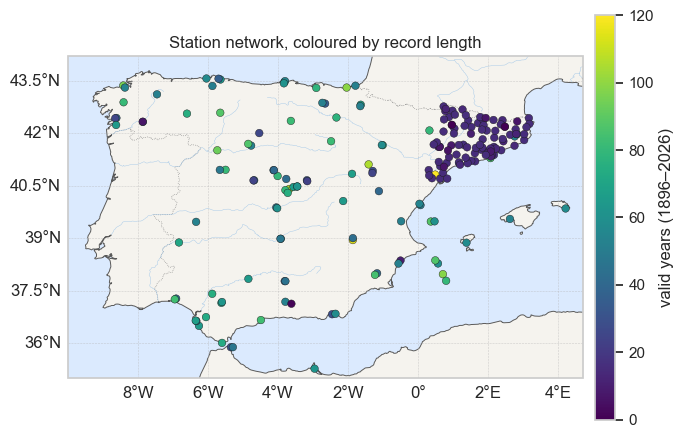
Block maxima at four time scales
We pick the best-covered (and warmest) station as a running example and extract its maxima at four block lengths: weekly, monthly, seasonal (3-month) and annual. The number of maxima shrinks by roughly the block length, while each maximum becomes more extreme.
order = valid_years + annual.mean("time") / 1e3       # coverage, tie-break warm
sidx = int(np.asarray(order.values).argmax())
sid = str(annual["station"].values[sidx])
lon, lat = float(da["lon"][sidx]), float(da["lat"][sidx])
label = station_label(sid, lon, lat)

SCALES = [("weekly", "W"), ("monthly", "ME"), ("seasonal", "QE"), ("annual", "YE")]
series = da.isel(station=sidx)
maxima = {name: temporal_block_maxima(series, freq=f, time_dim="time",
                                      keep_time=True).dropna("time")
          for name, f in SCALES}
print("showcase station:", label)
for name, _ in SCALES:
    m = maxima[name]
    print(f"  {name:>9}: {m.sizes['time']:>5} maxima   "
          f"mean {float(m.mean()):.1f} °C   max {float(m.max()):.1f} °C")
showcase station: SPE00175559 · near Barcelona, Spain
weekly: 87 maxima mean 24.1 °C max 38.2 °C
monthly: 24 maxima mean 28.1 °C max 38.2 °C
seasonal: 8 maxima mean 30.6 °C max 38.2 °C
annual: 3 maxima mean 35.5 °C max 38.2 °C
# locator map with a star
ax = iberia_axes(figsize=(7.5, 6.5))
mark_points(ax, annual["lon"].values, annual["lat"].values, s=12,
            color="0.45", alpha=0.7)
mark_star(ax, lon, lat, label=label.split(" · ")[1], size=520)
ax.set_title("Showcase station")
plt.show()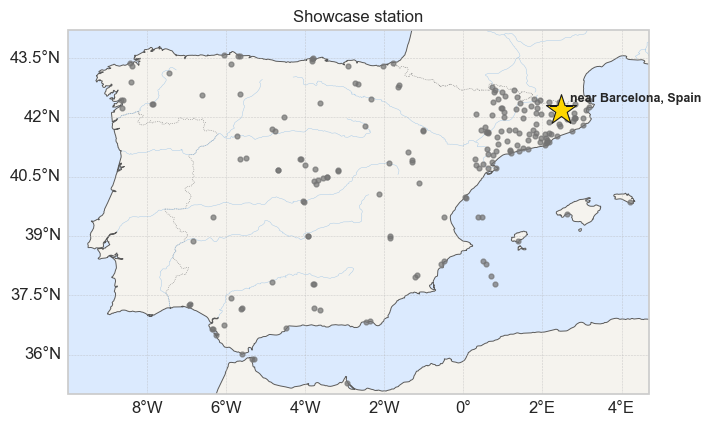
fig, axes = plt.subplots(2, 2, figsize=(12, 7), sharey=True)
colors = sns.color_palette("flare", 4)
for ax, (name, _), c in zip(axes.ravel(), SCALES, colors):
    ax.scatter(series["time"].values, series.values, s=3, alpha=0.12, color="0.6")
    m = maxima[name]
    ax.scatter(m["time_of_max"].values, m.values, s=24, color=c, edgecolor="k",
               linewidth=0.3, label=f"{name} maxima (n={m.sizes['time']})")
    ax.set_title(f"{name.capitalize()} block maxima")
    ax.legend(loc="lower left", fontsize=8)
    ax.set_ylabel("°C")
    ax.tick_params(axis="x", rotation=30)
fig.suptitle(f"{label}\nblock maxima at four time scales", y=1.0)
fig.tight_layout()
plt.show()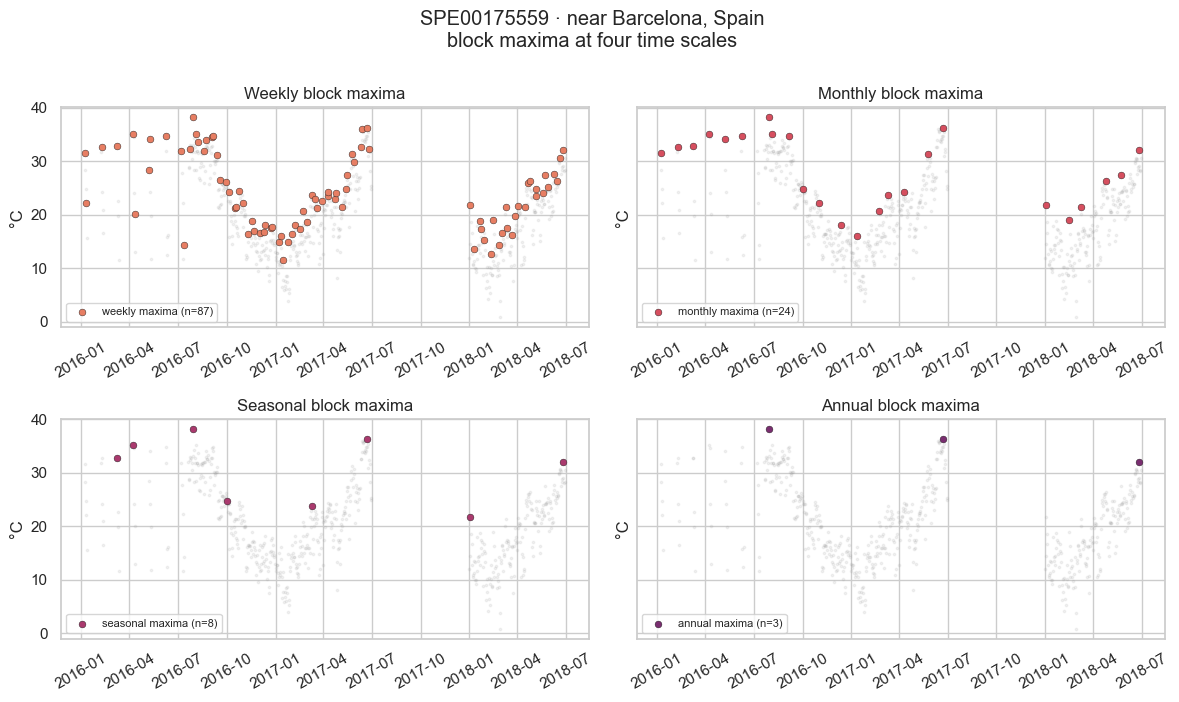
How block length shapes the distribution
Pooling the maxima across all stations, the histograms show the trade-off directly: short blocks pile up near the seasonal warm-season temperatures, while longer blocks push the mass right and thin the upper tail into a smooth, right-skewed shape. The dashed line marks each scale’s median.
def pooled(freq):
    m = temporal_block_maxima(da, freq=freq, time_dim="time")
    v = m.values[np.isfinite(m.values)]
    return v

fig, axes = plt.subplots(2, 2, figsize=(12, 7))
colors = sns.color_palette("flare", 4)
for ax, (name, freq), c in zip(axes.ravel(), SCALES, colors):
    v = pooled(freq)
    sns.histplot(v, bins=40, stat="density", color=c, ax=ax, edgecolor=None)
    ax.axvline(np.median(v), color="k", ls="--", lw=1)
    ax.set(title=f"{name.capitalize()} maxima  (n={v.size:,}, median {np.median(v):.1f} °C)",
           xlabel="block maximum (°C)", ylabel="density")
fig.suptitle("Pooled block maxima — distribution by block length", y=1.0)
fig.tight_layout()
plt.show()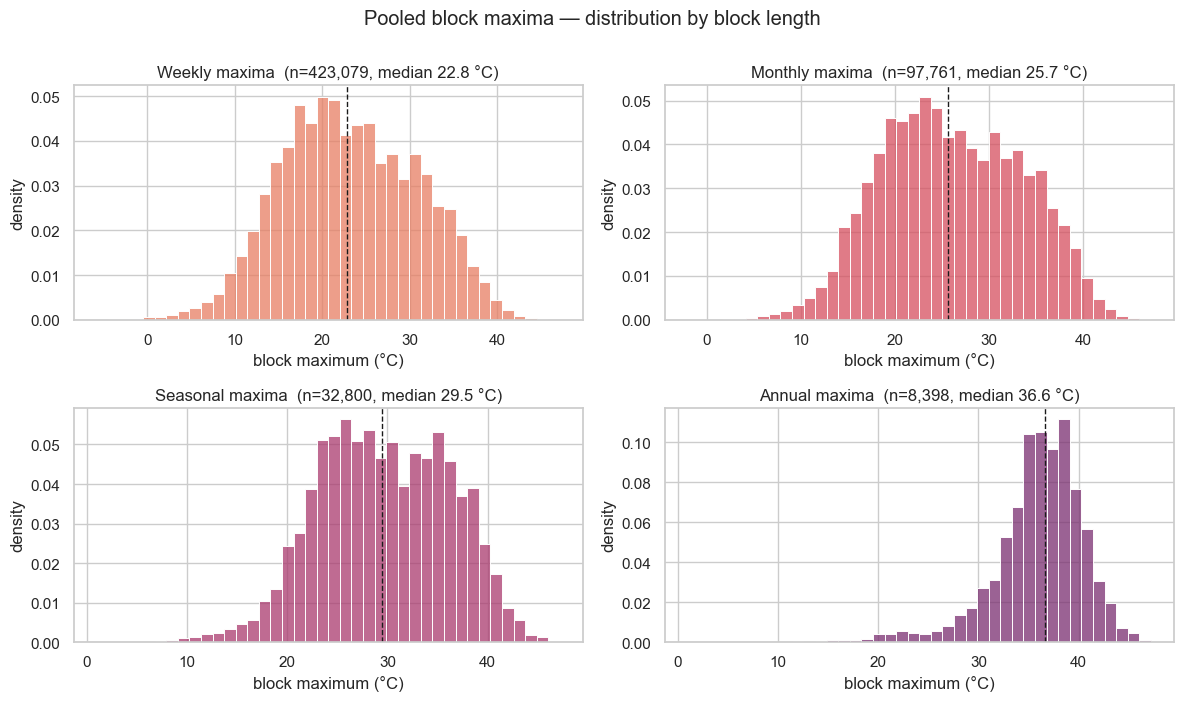
# the same four, overlaid as densities, to see the rightward march
fig, ax = plt.subplots(figsize=(9, 4.8))
for (name, freq), c in zip(SCALES, sns.color_palette("flare", 4)):
    sns.kdeplot(pooled(freq), ax=ax, label=name, color=c, lw=2, fill=True,
                alpha=0.08, cut=0)
ax.set(xlabel="block maximum (°C)", ylabel="density",
       title="Longer blocks → fewer, more extreme, more regular maxima")
ax.legend(title="block length")
plt.show()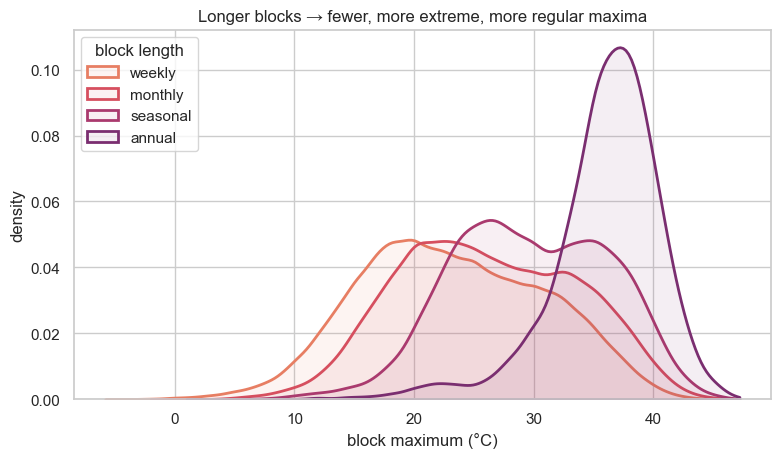
Why annual blocks for extremes?
There is a second reason to prefer long blocks. A block maximum is only a clean, comparable quantity if every block is drawn from the same conditions. Monthly maxima are not: a July maximum and a January maximum come from completely different seasonal regimes. An annual block folds a whole seasonal cycle into each maximum, so all the in (1) are comparable. The boxplot of this station’s monthly maxima makes the seasonal dependence obvious.
mm = temporal_block_maxima(series, freq="ME", time_dim="time")
mdf = mm.to_dataframe(name="tmax").dropna().reset_index()
mdf["month"] = mdf["time"].dt.month
fig, ax = plt.subplots(figsize=(9, 4.2))
sns.boxplot(data=mdf, x="month", y="tmax", ax=ax, color="#4C72B0", width=0.6)
ax.set_xticks(range(12), ["J", "F", "M", "A", "M", "J", "J", "A", "S", "O", "N", "D"])
ax.set(xlabel="month", ylabel="monthly maximum (°C)",
       title=f"{label.split(' · ')[1]}: monthly maxima are not identically distributed")
plt.show()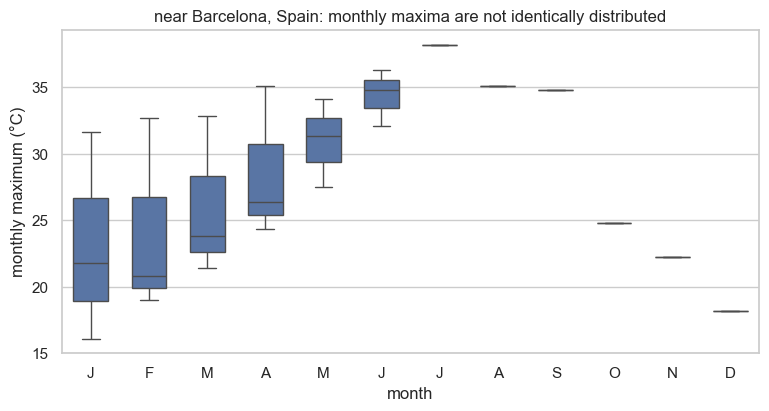
Recap & where next
Block maxima reduce a daily record to a handful of extremes, and the block length sets the bargain: shorter blocks give more but milder and seasonally mixed maxima; annual blocks give few, genuinely rare, mutually comparable maxima. From here on we work with annual maxima. In The GEV distribution we ask what distribution those annual maxima follow, and fit it to a single station.