Generating Trajectories and Missing Data
How to generate Trajectories and create missing data
import os, sys

jaxsw_path = "/Users/eman/code_projects/jaxsw"
sys.path.append(jaxsw_path)
import autoroot # noqa: F401, I001
import diffrax as dfx
import equinox as eqx
import jax
import jax.numpy as jnp
import jax.random as jrandom
import matplotlib.pyplot as plt
import numpy as np
import seaborn as sns
import xarray as xr
from jaxsw._src.models.lorenz63 import L63Params, L63State, Lorenz63, rhs_lorenz_63
sns.reset_defaults()
sns.set_context(context="talk", font_scale=0.7)
%matplotlib inline
%load_ext autoreload
%autoreload 2Lorenz 63
- Equation of Motion
- Observation Operator
- Integrate
Simulation
batchsize = 1_000
sigma, rho, beta = 10, 28, 2.667
key = jrandom.PRNGKey(42)
params = L63Params(sigma=10, rho=28, beta=2.667)
state_init = L63State.init_state(
    batchsize=batchsize, noise=0.01, key=key
)

l63_model = Lorenz63()

state_init.x.shape
(1000, 1)Time Stepping
Warmup
We need to do a warmup simulation to get the dynamical system to a steady state.
dt = 0.005
t0 = 0.0
t1 = 10.0
dt_save = 0.01
# observe_every = 10
ts = jnp.arange(t0, t1, dt_save)
num_tsteps = len(ts)

saveat = dfx.SaveAt(
    ts=ts,
)

# Euler, Constant StepSize
solver = dfx.Tsit5()
stepsize_controller = dfx.PIDController(rtol=1e-5, atol=1e-5)

integration_fn = lambda state: dfx.diffeqsolve(
    terms=dfx.ODETerm(l63_model.equation_of_motion),
    solver=solver,
    t0=ts.min(),
    t1=ts.max(),
    dt0=dt,
    y0=state,
    saveat=saveat,
    args=params,
    stepsize_controller=stepsize_controller,
)

# integration
sol = jax.vmap(integration_fn)(state_init)

sol.ys.x.shape
(1000, 1000, 1)Simulation
from tqdm.autonotebook import trange
for i in trange(10):
    # integration
    state_init = eqx.tree_at(lambda x: x.x, state_init, sol.ys.x[:, -1])
    state_init = eqx.tree_at(lambda x: x.y, state_init, sol.ys.y[:, -1])
    state_init = eqx.tree_at(lambda x: x.z, state_init, sol.ys.z[:, -1])

    sol = jax.vmap(integration_fn)(state_init)
Loading...
sol.ts[0, :200].shape, sol.ys.x[:200].shape((200,), (200, 1000, 1))ds_sol = xr.Dataset(
{
"x": (("realization", "time"), sol.ys.x[:, :200].squeeze()),
"y": (("realization", "time"), sol.ys.y[:, :200].squeeze()),
"z": (("realization", "time"), sol.ys.z[:, :200].squeeze()),
},
coords={
"time": (["time"], sol.ts[0, :200].squeeze()),
},
attrs={
"ode": "lorenz_63",
"sigma": params.sigma,
"beta": params.beta,
"rho": params.rho,
},
)
ds_solLoading...
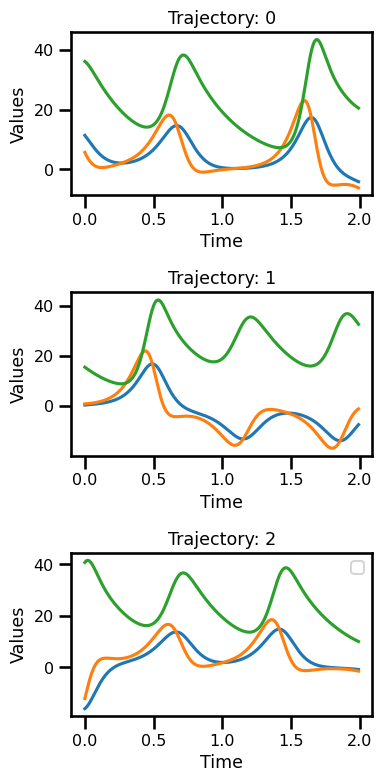
fig, ax = plt.subplots(nrows=3, figsize=(4, 8))

for i in range(3):
    ds_sol.x.sel(
        realization=i,
    ).plot(ax=ax[i])
    ds_sol.y.sel(
        realization=i,
    ).plot(ax=ax[i])
    ds_sol.z.sel(
        realization=i,
    ).plot(ax=ax[i])

    ax[i].set_xlabel("Time")
    ax[i].set_ylabel("Values")
    ax[i].set_title(f"Trajectory: {i}")


plt.legend()
plt.tight_layout()
plt.show()
No artists with labels found to put in legend. Note that artists whose label start with an underscore are ignored when legend() is called with no argument.
fig, ax = plt.subplots(ncols=3, subplot_kw={"projection": "3d"})
for i in range(3):
    ax[i].plot(
        ds_sol.x.sel(
            realization=i,
        ),
        ds_sol.y.sel(
            realization=i,
        ),
        ds_sol.z.sel(
            realization=i,
        ),
        lw=1.0,
        color="blue",
        label="Trajectory",
    )
    ax[i].set_xlabel("X")
    ax[i].set_ylabel("Y")
    ax[i].set_zlabel("Z")
# ax.scatter3D(out.x[::10], out.y[::10], out.z[::10], lw=0.5, color="red", label="y")


plt.legend()
plt.tight_layout()
plt.show()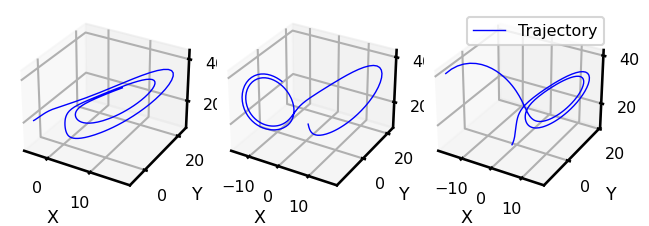
Generating Observations
ds_sol = ds_sol.to_array(dim="component", name="simulation").to_dataset()
ds_sol
Loading...
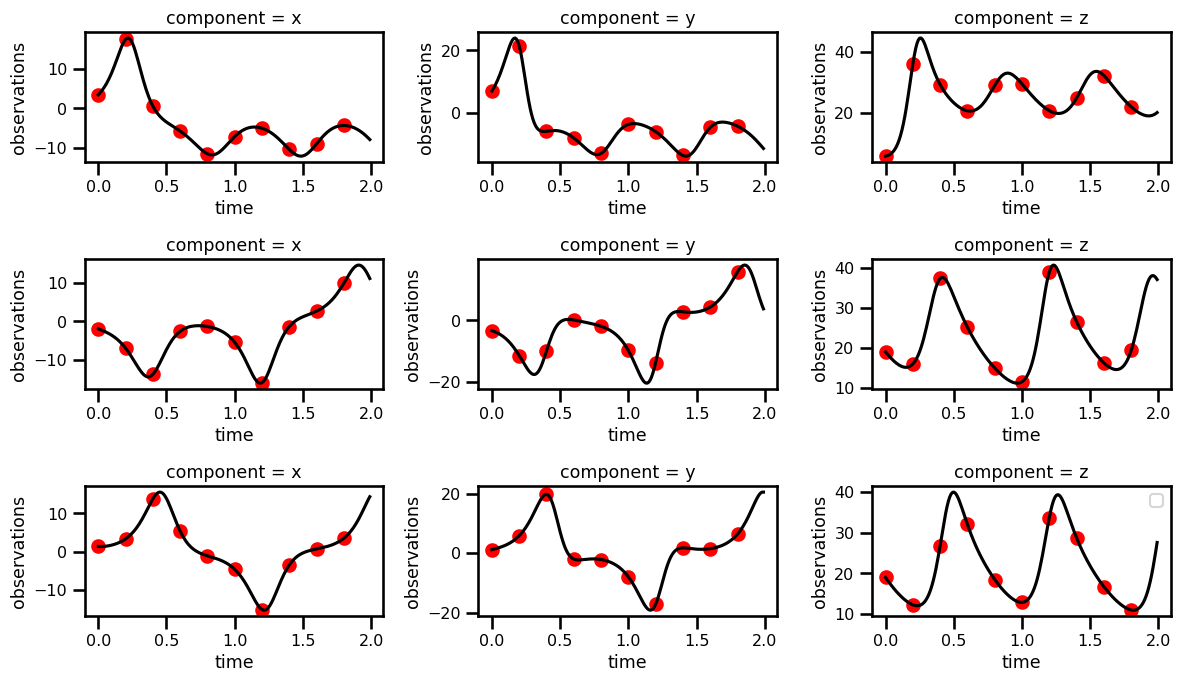
Missing Time
sample_step = 20
ds_sol["observations"] = xr.full_like(ds_sol.simulation, np.nan)
ds_sol["observations"].loc[..., ::sample_step] = ds_sol["simulation"].loc[
    ..., ::sample_step
]
fig, ax = plt.subplots(nrows=3, ncols=3, figsize=(12, 7))
for i in range(0, 3):
ds_sol.simulation.sel(realization=i + 100, component="x").plot(
ax=ax[i, 0], color="black"
)
ds_sol.observations.sel(realization=i + 100, component="x").plot.scatter(
ax=ax[i, 0], color="red"
)
ds_sol.simulation.sel(realization=i + 100, component="y").plot(
ax=ax[i, 1], color="black"
)
ds_sol.observations.sel(realization=i + 100, component="y").plot.scatter(
ax=ax[i, 1], color="red"
)
ds_sol.simulation.sel(realization=i + 100, component="z").plot(
ax=ax[i, 2], color="black"
)
ds_sol.observations.sel(realization=i + 100, component="z").plot.scatter(
ax=ax[i, 2], color="red"
)
plt.legend()
plt.tight_layout()
plt.show()No artists with labels found to put in legend. Note that artists whose label start with an underscore are ignored when legend() is called with no argument.
fig, ax = plt.subplots(ncols=3, subplot_kw={"projection": "3d"})
for i in range(3):
    ax[i].plot(
        ds_sol.simulation.sel(realization=i + 100, component="x"),
        ds_sol.simulation.sel(realization=i + 100, component="y"),
        ds_sol.simulation.sel(realization=i + 100, component="z"),
        lw=1.0,
        color="blue",
        label="Trajectory",
    )
    ax[i].scatter(
        ds_sol.observations.sel(realization=i + 100, component="x"),
        ds_sol.observations.sel(realization=i + 100, component="y"),
        ds_sol.observations.sel(realization=i + 100, component="z"),
        lw=1.0,
        color="red",
        label="Observations",
    )
    ax[i].set_xlabel("X")
    ax[i].set_ylabel("Y")
    ax[i].set_zlabel("Z")


plt.legend()
plt.tight_layout()
plt.show()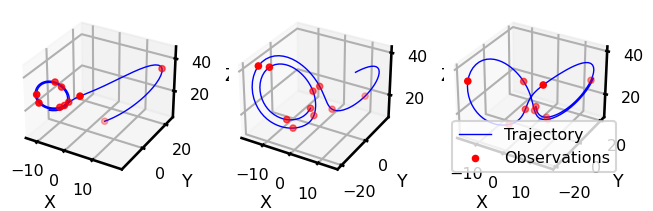
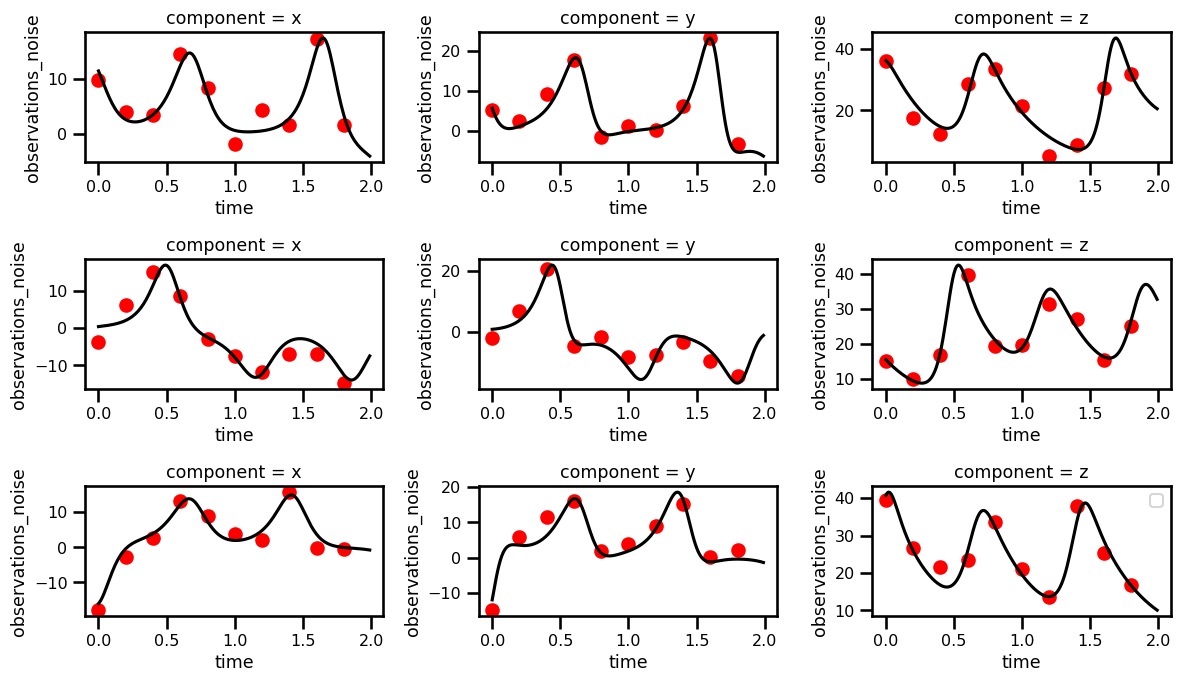
Adding Noise
# def add_noise(da, sigma=2**.5):
#     return da  + np.random.randn(*da.shape) * sigma

sigma = 2.0

ds_sol["observations_noise"] = ds_sol["observations"] + sigma * np.random.randn(
    *ds_sol["observations"].shape
)
fig, ax = plt.subplots(nrows=3, ncols=3, figsize=(12, 7))
for i in range(3):
ds_sol.simulation.sel(realization=i, component="x").plot(ax=ax[i, 0], color="black")
ds_sol.observations_noise.sel(realization=i, component="x").plot.scatter(
ax=ax[i, 0], color="red"
)
ds_sol.simulation.sel(realization=i, component="y").plot(ax=ax[i, 1], color="black")
ds_sol.observations_noise.sel(realization=i, component="y").plot.scatter(
ax=ax[i, 1], color="red"
)
ds_sol.simulation.sel(realization=i, component="z").plot(ax=ax[i, 2], color="black")
ds_sol.observations_noise.sel(realization=i, component="z").plot.scatter(
ax=ax[i, 2], color="red"
)
plt.legend()
plt.tight_layout()
plt.show()No artists with labels found to put in legend. Note that artists whose label start with an underscore are ignored when legend() is called with no argument.
fig, ax = plt.subplots(ncols=3, subplot_kw={"projection": "3d"})
for i in range(3):
    ax[i].plot(
        ds_sol.simulation.sel(realization=i, component="x"),
        ds_sol.simulation.sel(realization=i, component="y"),
        ds_sol.simulation.sel(realization=i, component="z"),
        lw=1.0,
        color="blue",
        label="Trajectory",
    )
    ax[i].scatter(
        ds_sol.observations_noise.sel(realization=i, component="x"),
        ds_sol.observations_noise.sel(realization=i, component="y"),
        ds_sol.observations_noise.sel(realization=i, component="z"),
        lw=1.0,
        color="red",
        label="Observations",
    )
    ax[i].set_xlabel("X")
    ax[i].set_ylabel("Y")
    ax[i].set_zlabel("Z")


plt.legend()
plt.tight_layout()
plt.show()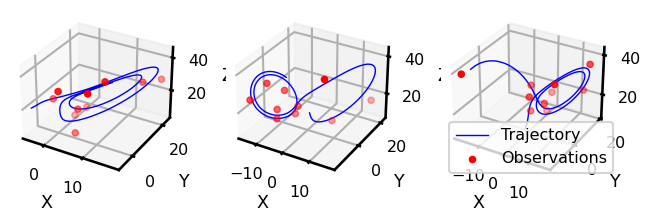
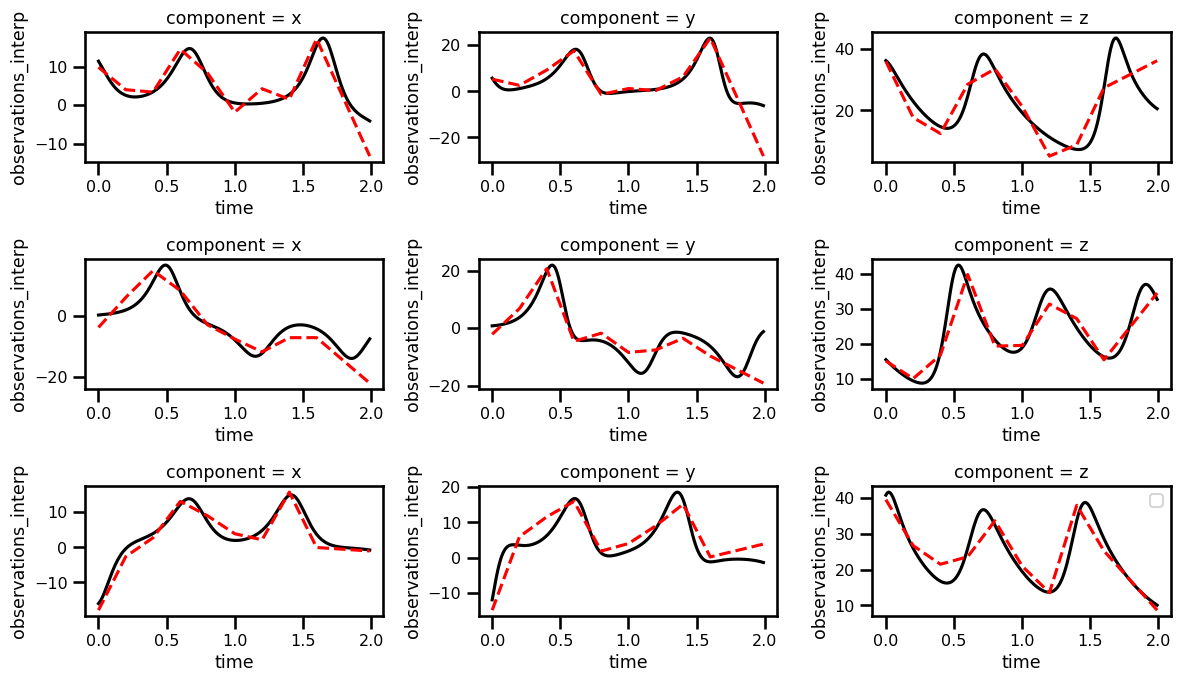
Initial Interpolation
import scipy
from tqdm.autonotebook import trange

variable_name = "observations_interp"

ds_sol[variable_name] = xr.full_like(ds_sol.observations_noise, np.nan)


for i in trange(ds_sol.simulation.shape[1]):
    dataarray = ds_sol["observations_noise"].sel(realization=i)

    # interpolate nans
    dataarray = dataarray.interpolate_na(
        dim="time", method="slinear", fill_value="extrapolate"
    )

    # set
    ds_sol[variable_name].loc[:, i, :] = dataarray
Loading...
fig, ax = plt.subplots(nrows=3, ncols=3, figsize=(12, 7))

for i in range(3):
    ds_sol.simulation.sel(realization=i, component="x").plot(ax=ax[i, 0], color="black")
    ds_sol.observations_interp.sel(realization=i, component="x").plot(
        ax=ax[i, 0], color="red", linestyle="--"
    )

    ds_sol.simulation.sel(realization=i, component="y").plot(ax=ax[i, 1], color="black")
    ds_sol.observations_interp.sel(realization=i, component="y").plot(
        ax=ax[i, 1], color="red", linestyle="--"
    )

    ds_sol.simulation.sel(realization=i, component="z").plot(ax=ax[i, 2], color="black")
    ds_sol.observations_interp.sel(realization=i, component="z").plot(
        ax=ax[i, 2], color="red", linestyle="--"
    )


plt.legend()
plt.tight_layout()
plt.show()
No artists with labels found to put in legend. Note that artists whose label start with an underscore are ignored when legend() is called with no argument.
fig, ax = plt.subplots(ncols=3, subplot_kw={"projection": "3d"})
for i in range(3):
    ax[i].plot(
        ds_sol.simulation.sel(realization=i, component="x"),
        ds_sol.simulation.sel(realization=i, component="y"),
        ds_sol.simulation.sel(realization=i, component="z"),
        lw=1.0,
        color="blue",
        label="Trajectory",
    )
    ax[i].plot(
        ds_sol.observations_interp.sel(realization=i, component="x"),
        ds_sol.observations_interp.sel(realization=i, component="y"),
        ds_sol.observations_interp.sel(realization=i, component="z"),
        lw=1.0,
        linestyle="--",
        color="red",
        label="Observations",
    )
    ax[i].set_xlabel("X")
    ax[i].set_ylabel("Y")
    ax[i].set_zlabel("Z")


plt.legend()
plt.tight_layout()
plt.show()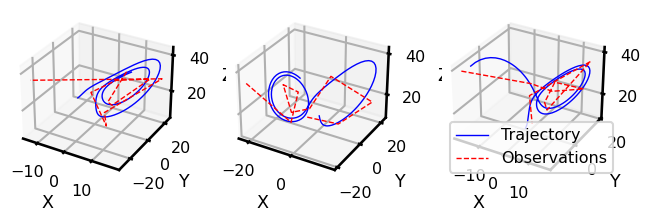
Save Simulation
!mkdir ./data
ds_sol.to_netcdf("./data/sim_l63.nc")
mkdir: ./data: File exists