- Jax-ify
- Don't Reinvent the Wheel
import autoroot
import jax
import jax.numpy as jnp
import numpy as np
import equinox as eqx
import kernex as kex
import finitediffx as fdx
import diffrax as dfx
import xarray as xr
import matplotlib.pyplot as plt
import seaborn as sns
from tqdm.notebook import tqdm, trange
from jaxtyping import Float, Array, PyTree, ArrayLike
import wandb
from jaxsw._src.domain.base import Domain
from jaxsw._src.models.pde import DynamicalSystem
from jaxsw._src.domain.time import TimeDomain

sns.reset_defaults()
sns.set_context(context="talk", font_scale=0.7)
jax.config.update("jax_enable_x64", True)

%matplotlib inline
%load_ext autoreload
%autoreload 2
Let's start with a simple 2D Linear Advection scheme. This PDE is defined as:
Here, we are advised to a backwards difference for the advection term, a second order central difference for the diffusion term and a first order time stepper for the time derivative.
Domain
nx = 101
xmin = 0.0
xmax = 2.0 * jnp.piDomain??Init signature: Domain(*args, **kwargs)
Source:
class Domain(eqx.Module):
"""Domain class for a rectangular domain
Attributes:
size (Tuple[int]): The size of the domain
xmin: (Iterable[float]): The min bounds for the input domain
xmax: (Iterable[float]): The max bounds for the input domain
coord (List[Array]): The coordinates of the domain
grid (Array): A grid of the domain
ndim (int): The number of dimenions of the domain
size (Tuple[int]): The size of each dimenions of the domain
cell_volume (float): The total volume of a grid cell
"""
xmin: tp.Iterable[float] = eqx.static_field()
xmax: tp.Iterable[float] = eqx.static_field()
dx: tp.Iterable[float] = eqx.static_field()
def __init__(self, xmin, xmax, dx):
"""Initializes domain
Args:
xmin (Iterable[float]): the min bounds for the input domain
xmax (Iterable[float]): the max bounds for the input domain
dx (Iterable[float]): the step size for the input domain
"""
assert len(xmin) == len(xmax)
dx = _check_and_return(dx, ndim=len(xmin), name="dx")
self.xmin = xmin
self.xmax = xmax
self.dx = dx
@classmethod
def from_numpoints(
cls,
xmin: tp.Iterable[float],
xmax: tp.Iterable[float],
N: tp.Iterable[int],
):
f = lambda xmin, xmax, N: (xmax - xmin) / (float(N) - 1)
dx = tuple(map(f, xmin, xmax, N))
return cls(xmin=xmin, xmax=xmax, dx=dx)
@property
def coords(self) -> tp.List:
return list(map(make_coords, self.xmin, self.xmax, self.dx))
@property
def grid(self) -> jnp.ndarray:
return make_grid_from_coords(self.coords)
@property
def ndim(self) -> int:
return len(self.xmin)
@property
def size(self) -> tp.Tuple[int]:
return tuple(map(len, self.coords))
@property
def Nx(self) -> tp.Tuple[int]:
return self.size
@property
def Lx(self) -> tp.Tuple[int]:
f = lambda xmin, xmax: xmax - xmin
return tuple(map(f, self.xmin, self.xmax))
@property
def cell_volume(self) -> float:
return reduce(mul, self.dx)
File: ~/code_projects/jaxsw/jaxsw/_src/domain/base.py
Type: _ModuleMeta
Subclasses: domain = Domain.from_numpoints(xmin=(xmin,), xmax=(xmax,), N=(nx,))
print(f"Nx: {domain.Nx}")
print(f"Lx: {domain.Lx}")
print(f"dx: {domain.dx}")
print(f"nDims: {domain.ndim}")
print(f"Grid Size: {domain.grid.shape}")
print(f"Cell Volume: {domain.cell_volume}")Nx: (101,)
Lx: (6.283185307179586,)
dx: (0.06283185307179587,)
nDims: 1
Grid Size: (101, 1)
Cell Volume: 0.06283185307179587
Initial Conditions
This probably has the most complicated initialization function I've seen in a while. It contains two functions:
Notice that the has another function as well as its partial derivative wrt to , .
import functools as ft


def phi(x, t, nu):
    denominator = 4 * nu * (t + 1)
    t1 = jnp.exp(-((x - 4 * t) ** 2) / denominator)
    t2 = jnp.exp(-((x - 4 * t - 2 * jnp.pi) ** 2) / denominator)
    return t1 + t2
In the original tutorial, they used sympy to calculate the derivative analytically and then they created a function. I'm a bit lazy, so I will simply use autodifferentiation to calculate the gradient exactly
dphi_dx = jax.grad(phi, argnums=0)Below, I use a nifty decorator to create a function that auto-vectorizes over the first argument.
@ft.partial(jax.vmap, in_axes=(0, None, None))
def init_u(x, t, nu):
    c = phi(x, t, nu)

    u = -((2 * nu) / c) * dphi_dx(x, t, nu) + 4

    return u
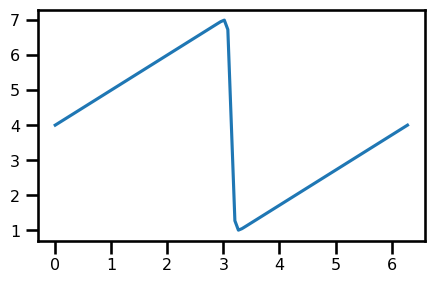
Now we can use this to initialize the Burger's function.
nu = 0.07
t = 0.0

u_init = init_u(domain.coords[0], 0, nu)

assert u_init.shape == domain.coords[0].shape
fig, ax = plt.subplots(figsize=(5, 3))
ax.plot(domain.grid.squeeze(), u_init)
plt.show()
def bc_fn(u: Float[Array, "D"]) -> Float[Array, "D"]:
    u = u.at[0].set(u[-1])

    return u
u_out = bc_fn(u_init)Equation of Motion
Looking at the previous equation (1) for Burgers 1D: Because we are doing advection, we will use backwards difference for each of the terms.
where is the central finite difference method.
from typing import Optional
from jaxsw._src.operators.functional import advection, diffusion


class Burgers1D(DynamicalSystem):
    @staticmethod
    def equation_of_motion(t: float, u: Array, args):
        u = bc_fn(u)

        nu, domain = args

        rhs_adv = advection.advection_1D(u=u, a=u, step_size=domain.dx)

        # rhs_adv = advection.advection_upwind_1D(u=u, a=u, step_size=domain.dx[0], accuracy=3)

        rhs_diff = diffusion.diffusion_1D(u=u, diffusivity=nu, step_size=domain.dx)

        return rhs_diff - rhs_adv
# SPATIAL DISCRETIZATION
u_init = init_u(domain.coords[0], 0, nu)
nu = 0.07
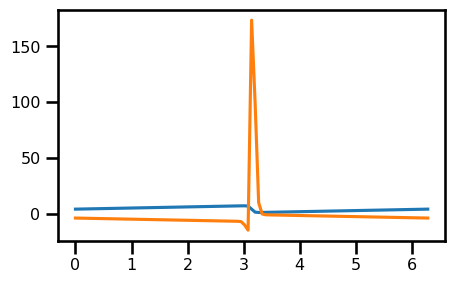
out = Burgers1D.equation_of_motion(0, u_init, (nu, domain))
out.min(), out.max()(Array(-14.83436605, dtype=float64), Array(173.49642625, dtype=float64))fig, ax = plt.subplots(figsize=(5, 3))
ax.plot(domain.grid.squeeze(), u_init)
ax.plot(domain.grid.squeeze(), out)
plt.show()
Time Stepping
# TEMPORAL DISCRETIZATION
# initialize temporal domain
tmin = 0.0
tmax = 0.5
num_save = 50
CFD Condition
# temporal parameters
c = 1.0
sigma = 0.2
nu = 0.07
dt = domain.dx[0] * nu
# SPATIAL DISCRETIZATION
u_init = init_u(domain.coords[0], 0, nu)
t_domain = TimeDomain(tmin=tmin, tmax=tmax, dt=dt)
ts = jnp.linspace(tmin, tmax, num_save)
saveat = dfx.SaveAt(ts=ts)
# DYNAMICAL SYSTEM
dyn_model = Burgers1D(t_domain=t_domain, saveat=saveat)u_init = init_u(domain.coords[0], 0, nu)
# Euler, Constant StepSize
solver = dfx.Tsit5()
stepsize_controller = dfx.ConstantStepSize()
sol = dfx.diffeqsolve(
terms=dfx.ODETerm(dyn_model.equation_of_motion),
solver=solver,
t0=ts.min(),
t1=ts.max(),
dt0=dt,
y0=u_init.squeeze(),
saveat=saveat,
args=(nu, domain),
stepsize_controller=stepsize_controller,
)u_analytical = jax.vmap(init_u, in_axes=(None, 0, None))(domain.coords[0], ts, nu)
u_analytical.shape(50, 101)Analysis
da_sol = xr.DataArray(
    data=np.asarray(sol.ys),
    dims=["time", "x"],
    coords={
        "x": (["x"], np.asarray(domain.coords[0])),
        "time": (["time"], np.asarray(sol.ts)),
    },
    attrs={"pde": "linear_convection", "c": c, "sigma": sigma},
)

da_analytical = xr.DataArray(
    data=np.asarray(u_analytical),
    dims=["time", "x"],
    coords={
        "x": (["x"], np.asarray(domain.coords[0])),
        "time": (["time"], np.asarray(ts)),
    },
    attrs={"pde": "linear_convection", "c": c, "sigma": sigma},
)
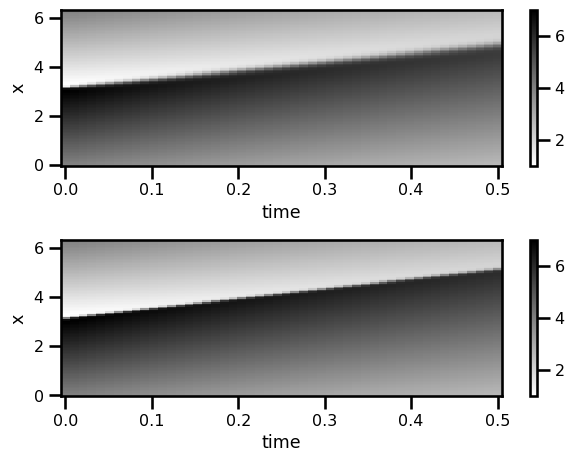
fig, ax = plt.subplots(nrows=2)
da_sol.T.plot.pcolormesh(ax=ax[0], cmap="gray_r")
da_analytical.T.plot.pcolormesh(ax=ax[1], cmap="gray_r")
plt.tight_layout()
plt.show()
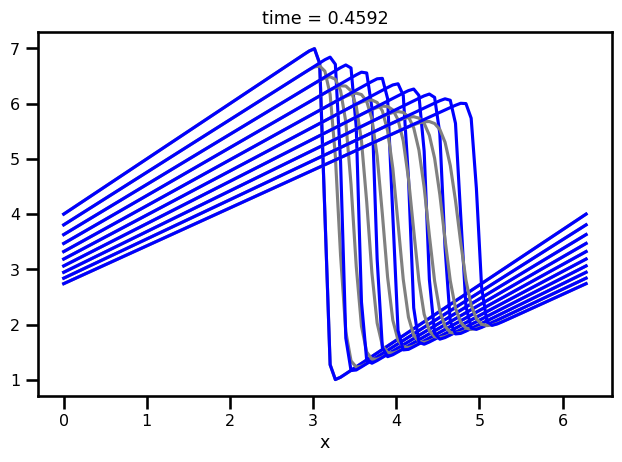
fig, ax = plt.subplots()

for i in range(0, len(da_sol.time), 5):
    da_sol.isel(time=i).plot.line(ax=ax, color="gray")
    da_analytical.isel(time=i).plot.line(ax=ax, color="blue")

plt.tight_layout()
plt.show()