Free-Run QG with SSH
import autoroot
import jax
import jax.numpy as jnp
import jax.scipy as jsp
from jax.config import config
import numpy as np
import numba as nb
import pandas as pd
import equinox as eqx
import finitediffx as fdx
import diffrax as dfx
import xarray as xr
import matplotlib.pyplot as plt
import seaborn as sns
from einops import rearrange, repeat, reduce
from tqdm.notebook import tqdm, trange
from jaxtyping import Array, Float

from jaxsw._src.operators.functional import advection as F_adv
from jaxsw._src.operators.functional import geostrophic as F_geos

sns.reset_defaults()
sns.set_context(context="talk", font_scale=0.7)
config.update("jax_enable_x64", True)


%matplotlib inline
%load_ext autoreload
%autoreload 2
In this problem, we are looking at sea surface height (SSH) in relation to the Quasi-Geostrophic (QG) equations. These equations are a simplified form for the Navier-Stokes equations with approximations like hydrostatic approximation, small aspect ratio, and a small Rossby number. Ideally, these equations might be a decent approximation at mesoscale (100km - 10,000km). In this application, we will see how SSH propagates with the QG equations.
Equations
This is a very simplified equation but
where:
- is the mean latitude
- is the Coriolis parameter at mean latitude
- is the -plane approximation at mean latitude
- is the Rossby deformation radius
- is the angular frequency of rotation
- is the radius of the Earth
Source:
Read input SSH
file = "/gpfswork/rech/yrf/commun/data_challenges/dc20a_osse/staging/natl60/NATL60-CJM165_GULFSTREAM_ssh_y2013.1y.nc"
file = "/Users/eman/code_projects/data/scratch/NATL60-CJM165_GULFSTREAM_ssh_y2013.1y.nc"


# ds = xr.open_dataset('/Users/eman/code_projects/data/scratch/NATL60_GULFSTREAM_degraded.nc')
# ds = xr.open_dataset('/Users/eman/code_projects/data/scratch/NATL60-CJM165_GULFSTREAM_ssh_y2013.1y.nc', decode_times=False).assign_coords(time=lambda ds: pd.to_datetime(ds.time))
# ds = xr.open_dataset("/Users/eman/code_projects/data/scratch/NATL60-CJM165_GULFSTREAM_ssh_y2013.1y.decoded.nc")
ds = xr.open_dataset(
    file,
    decode_times=False,
).assign_coords(time=lambda ds: pd.to_datetime(ds.time))
# ds = ds.coarsen(lon=3,lat=3).mean()
dsds.ssh.isel(time=0).plot.pcolormesh(cmap="viridis")<matplotlib.collections.QuadMesh at 0x14e518710>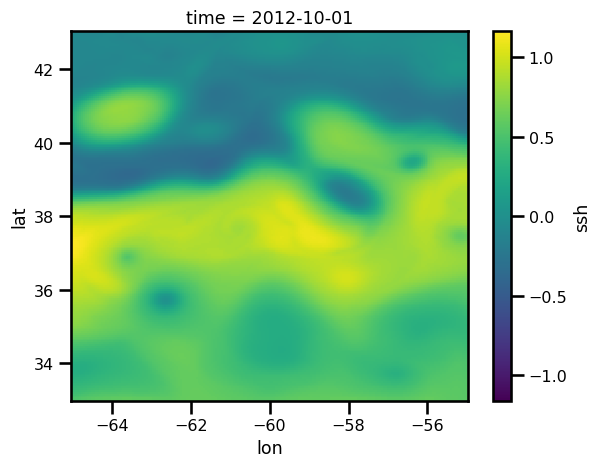
lon = ds.lon.values
lat = ds.lat.values
ssh = ds.ssh[0].values.T
plt.figure()
plt.pcolormesh(ssh.T)
plt.colorbar()<matplotlib.colorbar.Colorbar at 0x14e644290>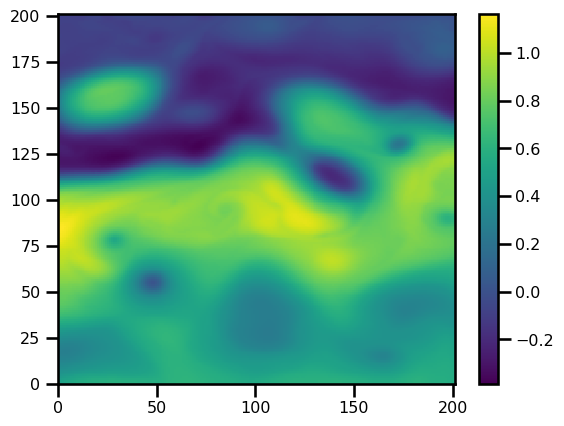
Strategy
This is a slightly different problem than some of the previous problems.
Lat/Lon Domain. Our domain is in
SSH. In this case, we have sea surface height "observations" but they are not actually used within the QG equations. So we need to do a transformation into the QG domain which is in terms of the stream function, , and the potential vorticity, .
Domain
Already, we have to do something slightly different than the previous tutorials. We are dealing with latitude/longitude so we need to do a coordinate transformation to x,y space, i.e. a local tangent plane. I have a specialized tutorial about how we do this in practice which can be found here (TODO).
from jaxsw._src.domain.latlon import LatLonMeanDomainlon = ds.lon.values
lat = ds.lat.values
ssh = jnp.asarray(ds.ssh[0].values.T)
domain = LatLonMeanDomain(lat=lat, lon=lon)
assert domain.size == (lon.shape[0], lat.shape[0])
domain.size, ssh.shape((201, 201), (201, 201))State
So here, we need to keep track of the following state variables:
where is the Sea Surface Height, is the stream function, and is the potential vorticity. All of them are along the same domain.
We also have some constants that we need to keep track of:
where is the coriolis parameter and is the beta-plane approximation at mean latitudes.
Initial Conditions
So these initial conditions are going to be slightly different than the previous cases: 1) we will initialize with real data and 2) we will have to "precalculate" some of the variables with the formulas listed above. So, let's come back to this until after we define all of the functions necessary.
Stream Function
Here, we can directly relate the
# F_geos.ssh_to_streamfn??# F_geos.streamfn_to_ssh??# forward transformation
psi = F_geos.ssh_to_streamfn(jnp.asarray(ssh), f0=domain.f0)
# inverse transform
ssh_ = F_geos.streamfn_to_ssh(psi, f0=domain.f0)
np.testing.assert_array_almost_equal(ssh, ssh_)Potential Vorticity
from jaxsw._src.boundaries.helmholtz import enforce_boundaries_helmholtz# streamfn_to_pv??c1 = 1.5
q = F_geos.streamfn_to_pvort(
psi, dx=domain.dx_mean, dy=domain.dx_mean, f0=domain.f0, c1=c1, accuracy=1
)
# q = enforce_boundaries_helmholtz(q, psi, beta=(f0/c1)**2)Stream Function from Potential Vorticity
psi_rec = F_geos.pvort_to_streamfn(
    q,
    psi,
    dx=domain.dx_mean,
    dy=domain.dx_mean,
    f0=domain.f0,
    c1=c1,
    accuracy=1,
)

print(np.max(np.abs(psi_rec - psi)))

ssh_rec = F_geos.streamfn_to_ssh(psi_rec, f0=domain.f0)
# np.testing.assert_array_almost_equal(psi, psi_rec)

print(np.max(np.abs(ssh_rec - ssh)))
1.7462298274040222e-10
1.5543122344752192e-15
RHS
We have the advection term which is the dot product between the geostrophic velocities and the gradient of the
if we plug in the actual terms, we get
Note, there is a famous common term that is used for a short hand notation. It's call the determinant Jacobian which is denoted as:
We can see that this is exactly equal to the above expression when we set and
Upwind Scheme
This term is an advection equation. So we can use the upwind scheme to deal with this.
where:
- is a backward finite difference scheme
- is a forward finite difference scheme
# upwind_2D??def advection_term_upwind(q, psi, dx, dy, **kwargs) -> Array:
# u,v schemes
u, v = F_geos.uv_velocity(psi, dx=dx, dy=dy, accuracy=kwargs.get("accuracy", 1))
# # Average Center Pixel
# u = F_grid.center_average_2D(u, padding="same")
# v = F_grid.center_average_2D(v, padding="same")
# # Average East-West & North-South
# u = F_grid.x_average_2D(u, padding="same")
# v = F_grid.y_average_2D(v, padding="same")
# print(u_avg.shape, v_avg.shape, q.shape)
adv_term = F_adv.advection_upwind_2D(q, a=u, b=v, step_size=(dx, dy))
rhs = jnp.zeros_like(q)
# rhs = rhs.at[1:-1, 1:-1].set(udq_dx[1:-1, 1:-1] + vdq_dy[1:-1, 1:-1])
rhs = rhs.at[1:-1, 1:-1].set(adv_term[1:-1, 1:-1])
return rhs
rhs = advection_term_upwind(
q, psi, domain.dx_mean, domain.dx_mean, method="central", way=-1
)
print(rhs.min(), rhs.max())-1.3750228959774459e-07 1.3953795940515203e-07
fig, ax = plt.subplots()

pts = ax.pcolormesh(rhs.T)
plt.colorbar(pts)

plt.show()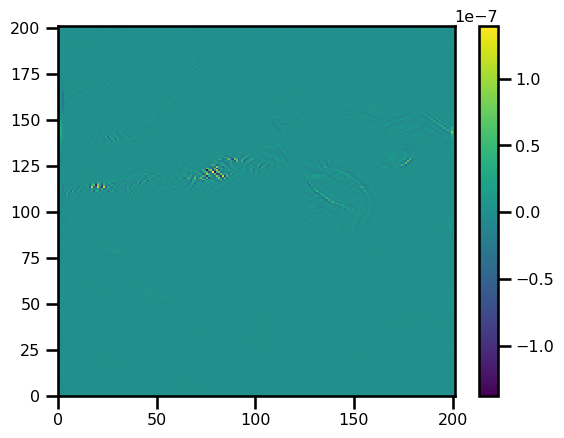
(Initial) State
Again, like all previous tutorials, we will use a nifty "state container" to help us keep track as we pass through the spatial discretizations and ODE solver.
from jaxsw._src.domain.latlon import LatLonMeanDomainlon = ds.lon.values
lat = ds.lat.values
ssh = jnp.asarray(ds.ssh[0].values.T)
domain = LatLonMeanDomain(lat=lat, lon=lon)
assert domain.size == (lon.shape[0], lat.shape[0])
domain.dx(Array(4381.27743094, dtype=float64), Array(5559.92086515, dtype=float64))from typing import Optional, NamedTuple, Callable, Union
from jaxtyping import Array
from jaxsw._src.domain.base import Domain
from jaxsw._src.domain.latlon import LatLonMeanDomain
class StateParams(NamedTuple):
domain: Domain
f0: float
beta: float
c1: float
eta: Array
class State(NamedTuple):
q: Array
@classmethod
def init_state(cls, da: xr.DataArray, c1: float = 1.5):
da = da.transpose("lon", "lat")
lon = da.lon.values
lat = da.lat.values
domain = LatLonMeanDomain(lat=lat, lon=lon)
# initialize parameters
eta = jnp.asarray(da.values)
f0 = domain.f0
beta = domain.beta
# ssh --> stream function
psi = F_geos.ssh_to_streamfn(eta, f0=f0)
# stream function --> potential vorticity
q = F_geos.streamfn_to_pvort(
psi, dx=domain.dx_mean, dy=domain.dx_mean, f0=f0, c1=c1, accuracy=1
)
q = enforce_boundaries_helmholtz(q, psi, beta=(f0 / c1) ** 2)
# initialize state parameters
state_params = StateParams(c1=c1, domain=domain, f0=f0, beta=beta, eta=eta)
return cls(q=q), state_params
def update_state(state, **kwargs):
return State(
q=kwargs.get("q", state.q),
)c1 = 1.5
f0 = domain.f0
beta = domain.beta
state, params = State.init_state(ds.ssh[0], c1=c1)
assert state.q.shape == ds.ssh[0].shape
assert params.c1 == 1.5
state_new = State.update_state(state, q=state.q + 1)
np.testing.assert_array_equal(state_new.q, state.q + 1)Equation of Motion
# from jaxsw._src.operators.functional.fd import jacobianfrom jaxsw._src.domain.base import Domain
from jaxsw._src.models.pde import DynamicalSystem
from jaxsw._src.domain.time import TimeDomain
class QG(DynamicalSystem):
@staticmethod
def equation_of_motion(t: float, state: State, args):
"""Quasi-Geostrophic Equations
Equation:
∂q/∂t + det J(Ψ,q) = -β ∂Ψ/∂x
q = ∇²Ψ - (f₀²/c₁²) Ψ
Ψ = (f₀/g) η
"""
# parse params
params = args
dx = dy = params.domain.dx_mean
f0, beta, c1, eta = params.f0, params.beta, params.c1, params.eta
# print("Before:", state.q.min(), state.q.max())
# parse state
q = state.q
# ssh -> stream function
psi_bv = F_geos.ssh_to_streamfn(ssh=eta, f0=f0)
# potential vorticity -> stream function
psi = F_geos.pvort_to_streamfn(
q, psi_bv, dx=dx, dy=dy, f0=f0, c1=c1, accuracy=1
)
# upwind scheme for advection
q_rhs = -advection_term_upwind(
q=q, psi=psi, dx=dx, dy=dy, way=-1, method="central"
)
# q_rhs = -jacobian(p=psi, q=q, dx=dx, dy=dy)
# q_rhs += 10 * fdx.laplacian(q, step_size=(dx,dy))
# beta term
_, v = F_geos.uv_velocity(psi, dx=dx, dy=dy)
q_rhs += -beta * v
# update state
state = State.update_state(state, q=q_rhs)
# print("After:", state.q.min(), state.q.max())
return state
@staticmethod
def ssh_from_state(state, params, axis: int = -1) -> Array:
dx = dy = params.domain.dx_mean
f0, c1, eta = params.f0, params.c1, params.eta
q = state.q
if q.ndim > 2:
q = q[axis]
psi_bv = F_geos.ssh_to_streamfn(ssh=eta, f0=f0)
psi = F_geos.pvort_to_streamfn(
q, psi_bv, dx=dx, dy=dy, f0=f0, c1=c1, accuracy=1
)
return F_geos.streamfn_to_ssh(psi, f0=domain.f0)# SPATIAL DISCRETIZATION
# initialize state
state_init, params = State.init_state(ds.ssh[0], c1=c1)
# right hand side
state_out = QG.equation_of_motion(0, state_init, params)# plot_state_2D(state_out)
# plot_state_3D(state_out)
# plot_vectorfield_2D(state_out)fig, ax = plt.subplots()
pts = ax.imshow(state_out.q.T, origin="lower")
plt.colorbar(pts)
plt.show()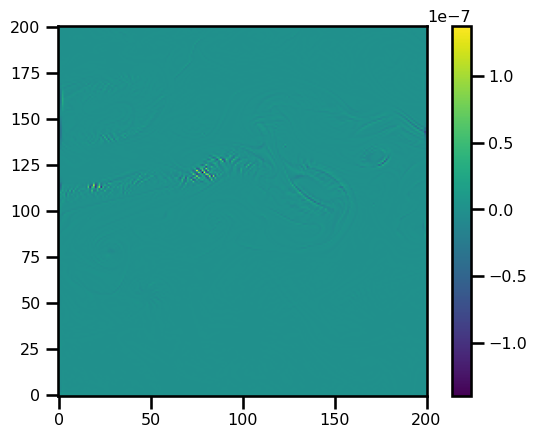
Time Stepping with Diffrax (All together)
dt_ = np.timedelta64(1, "h")
pd.to_timedelta(dt_).total_seconds()3600.0# TEMPORAL DISCRETIZATION
# initialize temporal domain
num_minutes = 30
dt = pd.to_timedelta(num_minutes, unit="minutes").total_seconds()
debug = False
num_days = 5
tmin = 0.0
tmax = pd.to_timedelta(num_days, unit="days").total_seconds()
num_hours_save = 12
dt_save = pd.to_timedelta(num_hours_save, unit="hours").total_seconds()
print(f"Step Size (dt): {int(dt/60)} minutes")
print(f"Tmax: {num_days} days")
print(f"Tmax: {tmax:,} seconds | {int(tmax/60/60/24)} day(s)")Step Size (dt): 30 minutes
Tmax: 5 days
Tmax: 432,000.0 seconds | 5 day(s)
# time domain
t_domain = TimeDomain(tmin=tmin, tmax=tmax, dt=dt)


t_domain
TimeDomain(tmin=0.0, tmax=432000.0, dt=1800.0)num_hours_save = 6
dt_save = pd.to_timedelta(num_hours_save, unit="hours").total_seconds()
ts = jnp.arange(tmin, tmax, dt_save)
saveat = dfx.SaveAt(ts=ts)# SPATIAL DISCRETIZATION
# initialize state
solver = dfx.Euler() #
# max_steps = 10
# DYNAMICAL SYSTEM
dyn_model = QG(t_domain=t_domain, saveat=saveat, solver=solver)%%time
state_init, params = State.init_state(ds.ssh[0], c1=c1)
state_sol = dyn_model.integrate(state_init, dt, params, max_steps=10_000)CPU times: user 4.69 s, sys: 153 ms, total: 4.84 s
Wall time: 4.78 s
state_sol.q.shape(20, 201, 201)ssh_t = QG.ssh_from_state(state_sol, params, axis=-1)
ssh_t.min(), ssh_t.max()(Array(-0.33095231, dtype=float64), Array(1.16310116, dtype=float64))fig, ax = plt.subplots(ncols=3, nrows=2, figsize=(10, 5))
#
ds.ssh[0].plot.pcolormesh(ax=ax[0, 0], cmap="viridis")
ds.ssh[0].plot.contour(ax=ax[0, 0], cmap="viridis")
ax[0, 0].set(title=f"SSH ($t=0$ days)")
ax[0, 1].contour(ds.ssh[num_days].values, cmap="viridis")
pts = ax[0, 1].imshow(ds.ssh[num_days].values, origin="lower", cmap="viridis")
plt.colorbar(pts)
ax[0, 1].set(title=f"True SSH ($t={num_days}$ days)")
ax[0, 2].contour(np.flipud(ssh_t.T), cmap="viridis")
pts = ax[0, 2].imshow(np.flipud(ssh_t.T), cmap="viridis")
ax[0, 2].set(title=f"QG Model ($t={num_days}$ days)")
plt.colorbar(pts)
pts = ax[1, 0].imshow(np.abs(ds.ssh[0].values.T - ds.ssh[num_days].values), cmap="Reds")
plt.colorbar(pts)
ax[1, 0].set(title=f"Diff SSH (T - $t_0$)")
pts = ax[1, 1].imshow(np.abs(ds.ssh[0].values.T - ssh_t.T), cmap="Reds")
plt.colorbar(pts)
ax[1, 1].set(title=f"Diff QG (T - $t_0$)")
pts = ax[1, 2].imshow(np.abs(ds.ssh[num_days].values - ssh_t.T), cmap="Reds")
plt.colorbar(pts)
ax[1, 2].set(title=f"Diff QG vs SSH (@T={num_days})")
plt.tight_layout()
plt.show()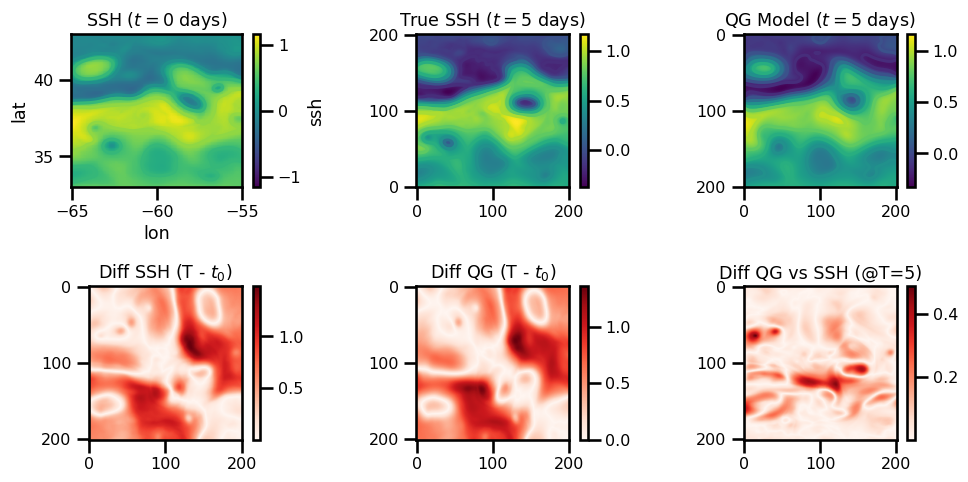
- Pedlosky, J. (1987). Geophysical Fluid Dynamics. Springer New York. 10.1007/978-1-4612-4650-3
- Vallis, G. K. (2017). Atmospheric and Oceanic Fluid Dynamics. Cambridge University Press. 10.1017/9781107588417