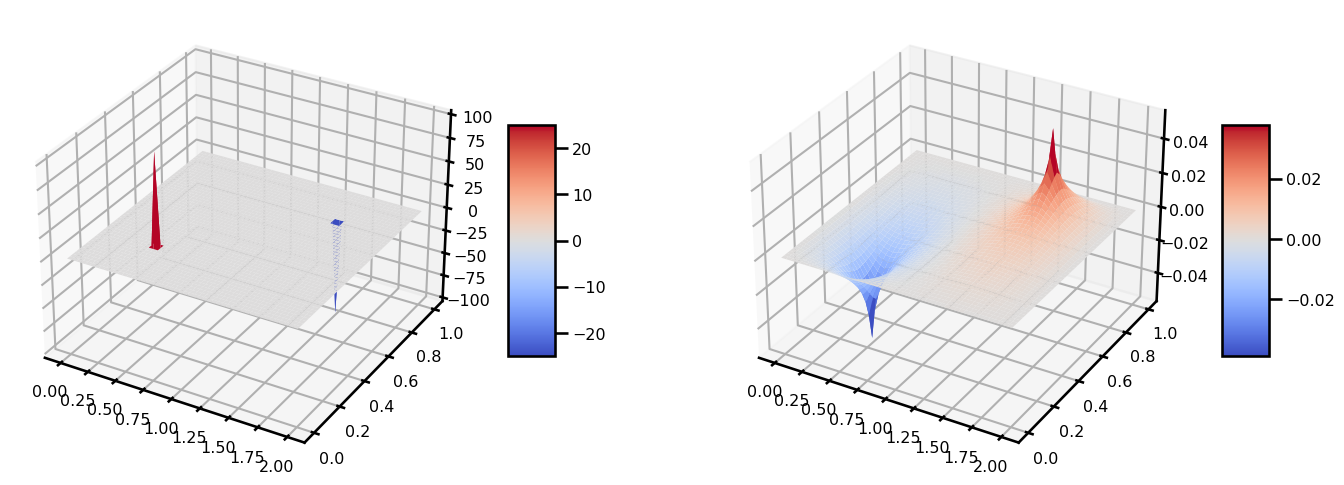
This tutorial comes from the following resources:
My Notes:
- I had some serious stability issues from the time stepper. The CFL Condition is important!
- The code started to get a bit cumbersome, so I used a custom state + abstract functions.
import autoroot
import jax
import jax.numpy as jnp
import numpy as np
import numba as nb
import equinox as eqx
import kernex as kex
import finitediffx as fdx
import diffrax as dfx
import xarray as xr
import matplotlib.pyplot as plt
import seaborn as sns
from tqdm.notebook import tqdm, trange
from jaxtyping import Float, Array, PyTree, ArrayLike
import wandb
from jaxsw._src.domain.base import Domain
from jaxsw._src.models.pde import DynamicalSystem
from jaxsw._src.domain.time import TimeDomain
from jaxsw._src.utils.linear_solver import steepest_descent, conjugate_gradient
import functools as ft

sns.reset_defaults()
sns.set_context(context="talk", font_scale=0.7)
jax.config.update("jax_enable_x64", True)

%matplotlib inline
%load_ext autoreload
%autoreload 2
Let's start with a simple Laplacian scheme. We have a field, u, with a Laplacian operator.
Here, we are advised to use a 2nd order accuracy central difference method.
However, this is a PDE with no time dependence. We have a minimization problem where we want the best that solves the PDE. More concretely, we have
So we need to iteratively solve for this. Basically we will do:
u_0 = ...
u_* = FixedPoint(u_0)
Domain
# nx, ny = 101, 101
# xmin, ymin = 0.0, -0.5
# xmax, ymax = 1.0, 0.5
# Lx, Ly = xmax -xmin, ymax -ymin

nx, ny = 50, 50
xmin, xmax = 0, 2
ymin, ymax = 0, 1
domain = Domain.from_numpoints(xmin=(xmin, ymin), xmax=(xmax, ymax), N=(nx, ny))
print(f"Size: {domain.size}")
print(f"nDims: {domain.ndim}")
print(f"Grid Size: {domain.grid.shape}")
print(f"Cell Volume: {domain.cell_volume}")Size: (50, 50)
nDims: 2
Grid Size: (50, 50, 2)
Cell Volume: 0.0008329862557267803
def init_u0(domain):
    """Initial condition from grid"""
    nx, ny = domain.size
    u = jnp.zeros((nx, ny), dtype=jnp.float64)

    return u
# def source(domain):
# xmin, ymin = domain.xmin
# xmax, ymax = domain.xmax
# Lx, Ly = xmax - xmin, ymax - ymin
# b = (
# -2.0 * (jnp.pi/Lx) * (jnp.pi/Ly) *
# jnp.sin(jnp.pi * domain.grid[...,0] / Lx) *
# jnp.cos(jnp.pi * domain.grid[...,1] / Ly)
# )
# return b
def source(domain):
nx, ny = domain.size
b = jnp.zeros((nx, ny))
b = b.at[int(nx / 4), int(ny / 4)].set(100)
b = b.at[int(3 * nx / 4), int(3 * ny / 4)].set(-100)
return bb = source(domain)
b.shape(50, 50)u_init = init_u0(domain)grid = domain.gridu_init.shape(50, 50)from matplotlib import cm
fig, ax = plt.subplots(ncols=2, figsize=(15, 5), subplot_kw={"projection": "3d"})
surf = ax[0].plot_surface(grid[..., 0], grid[..., 1], u_init, cmap=cm.coolwarm)
plt.colorbar(surf, shrink=0.5, aspect=5)
surf = ax[1].plot_surface(grid[..., 0], grid[..., 1], b, cmap=cm.coolwarm)
plt.colorbar(surf, shrink=0.5, aspect=5)
plt.tight_layout()
plt.show()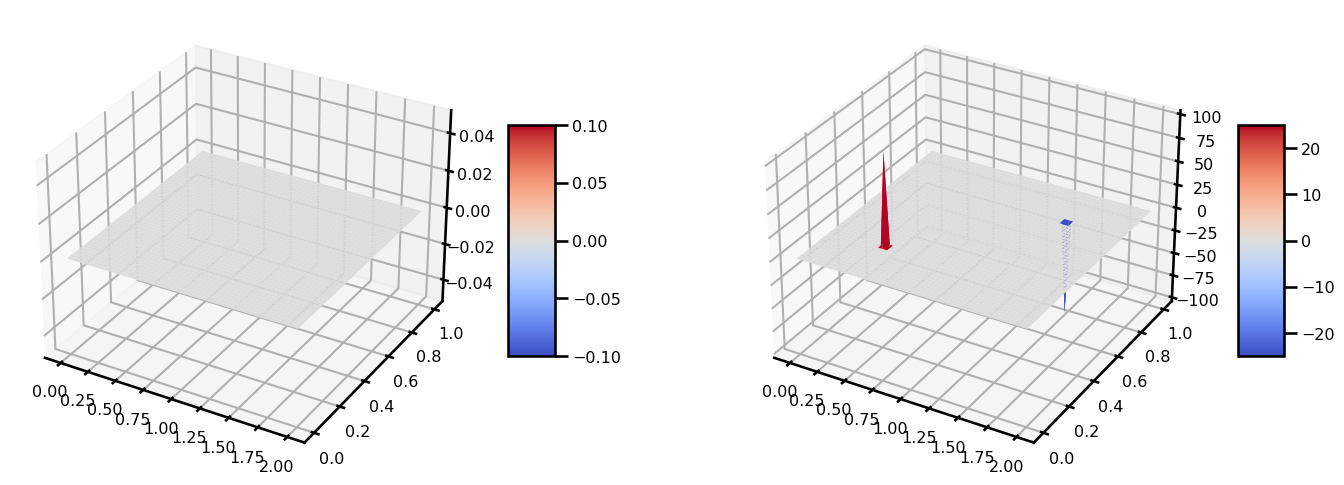
domain.size(50, 50)Boundary Conditions
We are using the same boundary conditions as before, 1's everywhere.
Note, we use the same BCs for both and .
def bc_fn(u: Array) -> Array:
    u = u.at[0, :].set(0.0)
    u = u.at[-1, :].set(0.0)
    u = u.at[-2, :].set(0.0)
    u = u.at[:, 0].set(0.0)
    u = u.at[:, -2].set(0.0)
    u = u.at[:, -1].set(0.0)
    return u
Equation of Motion
Because we are doing advection, we will use backwards difference for each of the terms.
where is the 2nd order accurate central difference method.
It's starting to get a bit cumbersome to put everything into a single equation, so we will start making functions for each other terms.
State
So for the "state", we need access to 2 variables and 1 constant: , , . So we will create a "container" to hold these objects. A natural option is to use a NamedTuple. This is an immutable object that we can just use to pass around.
Bonus: Notice I used a nice python trick to create the state using a convenience function. This particular function initializes the state from a function that we pass through it.
from typing import Optional, NamedTuple, Callable


class State(NamedTuple):
    u: Array
    domain: Domain

    @classmethod
    def init_state(cls, domain, init_f: Callable):
        u = init_u0(domain)

        return cls(u=u, domain=domain)

    @staticmethod
    def update_state(state, u=None, domain=None):
        return State(
            u=u if u is not None else state.u,
            domain=domain if domain is not None else state.domain,
        )
state_init = State.init_state(domain, init_u0)
# update state (manually)
state_update = State(u=state_init.u, domain=state_init.domain)
# update state (convenience function)
state_update_ = eqx.tree_at(lambda x: x.u, state_init, state_init.u)
# state_update_ = State.update_state(state_init, u=state_init.u)
assert state_update == state_update_Laplacian Equation
We have the advection term for both and :
They recommend that we use the 1st order accurate backward difference scheme. We will make a generic advection function term that should work for both and .
from jaxsw._src.operators.functional import ellipticalSteepest Descent (From Scratch)
target_criterion = 1e-4
max_iterations = 10_000
criterion = "l2"
u = init_u0(domain).copy()
b = source(domain)

matvec_fn = ft.partial(elliptical.laplacian_matvec, step_size=domain.dx, bc_fn=bc_fn)


out = steepest_descent(
    b=b,
    matvec_fn=matvec_fn,
    u_init=u,
    target_criterion=target_criterion,
    max_iterations=max_iterations,
    criterion=criterion,
)
out.iteration, out.loss
(Array(1074, dtype=int64, weak_type=True),
Array(9.96658815e-05, dtype=float64))from matplotlib import cm
fig, ax = plt.subplots(ncols=2, figsize=(15, 5), subplot_kw={"projection": "3d"})
surf = ax[0].plot_surface(grid[..., 0], grid[..., 1], b, cmap=cm.coolwarm)
plt.colorbar(surf, shrink=0.5, aspect=5)
surf = ax[1].plot_surface(grid[..., 0], grid[..., 1], out.u, cmap=cm.coolwarm)
plt.colorbar(surf, shrink=0.5, aspect=5)
plt.tight_layout()
plt.show()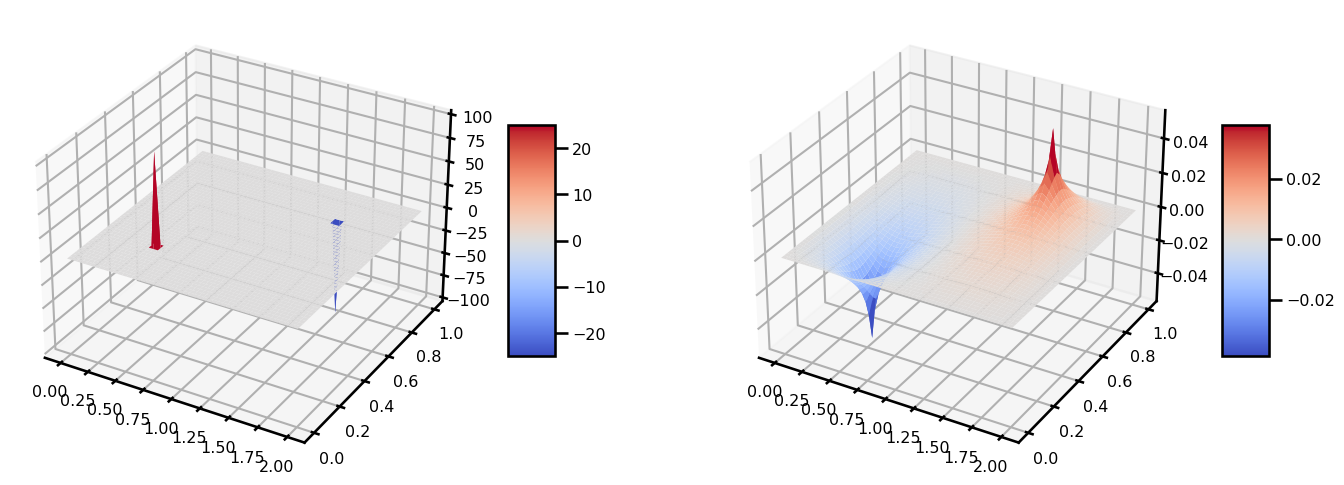
Conjugate Gradient (From Scratch)
import functools as ft


target_criterion = 1e-6
max_iterations = 1000
criterion = "l2"
u = init_u0(domain).copy()
b = source(domain)

matvec_fn = ft.partial(elliptical.laplacian_matvec, step_size=domain.dx, bc_fn=bc_fn)


out = conjugate_gradient(
    b=b,
    matvec_fn=matvec_fn,
    u_init=u,
    target_criterion=target_criterion,
    max_iterations=max_iterations,
    criterion=criterion,
)
out.iteration, out.loss
(Array(136, dtype=int64, weak_type=True), Array(9.44066372e-07, dtype=float64))from matplotlib import cm
fig, ax = plt.subplots(ncols=2, figsize=(15, 5), subplot_kw={"projection": "3d"})
surf = ax[0].plot_surface(grid[..., 0], grid[..., 1], u, cmap=cm.coolwarm)
plt.colorbar(surf, shrink=0.5, aspect=5)
surf = ax[1].plot_surface(grid[..., 0], grid[..., 1], out.u, cmap=cm.coolwarm)
plt.colorbar(surf, shrink=0.5, aspect=5)
plt.tight_layout()
plt.show()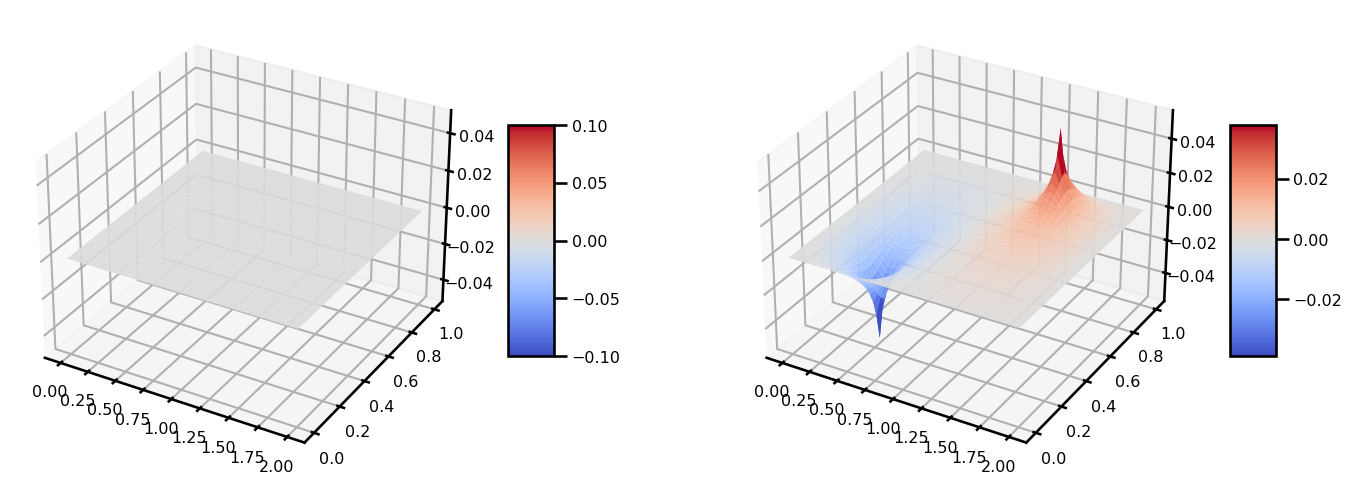
JaxOpt
This is a general purpose optimization package using the JAX framework.
import typing as tp
from jaxopt import linear_solve
from jaxsw._src.utils.linear_solver import jaxopt_linear_solver


# define initial state
u_init = init_u0(domain).copy()

# define RHS
b = source(domain)

# define solver
solver = linear_solve.solve_cg  # BiCGStab, NormalCG, GMRES, CG
solver_kwargs = dict(maxiters=10_000, tol=1e-5)

# create matvec_fn
matvec_fn = ft.partial(elliptical.laplacian_matvec, step_size=domain.dx, bc_fn=bc_fn)

# get solution
u_out = jaxopt_linear_solver(matvec_fn=matvec_fn, b=b, solver=solver)
from matplotlib import cm
fig, ax = plt.subplots(ncols=2, figsize=(15, 5), subplot_kw={"projection": "3d"})
surf = ax[0].plot_surface(grid[..., 0], grid[..., 1], b, cmap=cm.coolwarm)
plt.colorbar(surf, shrink=0.5, aspect=5)
surf = ax[1].plot_surface(grid[..., 0], grid[..., 1], u_out, cmap=cm.coolwarm)
plt.colorbar(surf, shrink=0.5, aspect=5)
plt.tight_layout()
plt.show()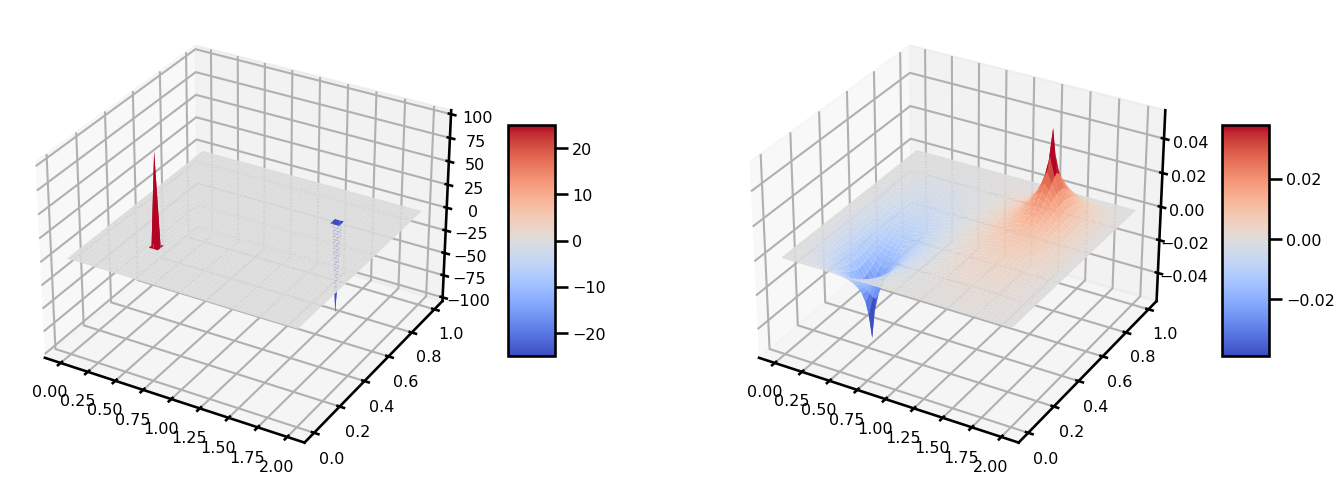
Lineax
This is a fairly new package that came out which does some linear solvers using the equinox framework.
import typing as tp
import lineax as lx
from jaxsw._src.utils.linear_solver import lx_linear_solver
# define initial state
u_init = init_u0(domain).copy()
# define RHS
b = source(domain)
# define solver
solver = lx.GMRES(rtol=1e-6, atol=1e-6) # BiCGStab, NormalCG, GMRES, CG
# create matvec_fn
matvec_fn = ft.partial(elliptical.laplacian_matvec, step_size=domain.dx, bc_fn=bc_fn)
# get solution
u_out = lx_linear_solver(matvec_fn, b, solver=solver, verbose=True){'max_steps': None, 'num_steps': Array(27, dtype=int64)}
from matplotlib import cm

fig, ax = plt.subplots(ncols=2, figsize=(15, 5), subplot_kw={"projection": "3d"})
surf = ax[0].plot_surface(grid[..., 0], grid[..., 1], b, cmap=cm.coolwarm)
plt.colorbar(surf, shrink=0.5, aspect=5)
surf = ax[1].plot_surface(grid[..., 0], grid[..., 1], u_out, cmap=cm.coolwarm)
plt.colorbar(surf, shrink=0.5, aspect=5)
plt.tight_layout()
plt.show()