Linear Shallow Water Model - Jet Example
import autoroot
import jax
import jax.numpy as jnp
import numpy as np
import equinox as eqx
import kernex as kex
import finitediffx as fdx
import diffrax as dfx
import xarray as xr
import matplotlib.pyplot as plt
import seaborn as sns
import typing as tp
from tqdm.notebook import tqdm, trange
from jaxtyping import Float, Array, PyTree, ArrayLike
import pandas as pd
from jaxsw._src.domain.base import Domain
from jaxsw._src.models.pde import DynamicalSystem
from jaxsw._src.domain.time import TimeDomain
from jaxsw._src.operators.functional import grid as F_grid
from jaxsw._src.models.sw import Params as SWMParams, State as SWMState
from jaxsw._src.models.sw.linear import LinearShallowWater2D

sns.reset_defaults()
sns.set_context(context="talk", font_scale=0.7)
jax.config.update("jax_enable_x64", True)

%matplotlib inline
%load_ext autoreload
%autoreload 2State
Here, we have 3 fields we have to content with:
- - height
- - u-velocity (zonal velocity)
- - v-velocity (meridonal velocity)
So our state will be a container for each of these fields.
SWMState??Init signature: SWMState(u: jax.Array, v: jax.Array, h: jax.Array)
Docstring: State(u, v, h)
Source:
class State(tp.NamedTuple):
u: Array
v: Array
h: Array
@classmethod
def init_state(cls, params, init_h=None, init_v=None, init_u=None):
h = init_h(params) if init_h is not None else State.zero_init(params.domain)
v = init_v(params) if init_v is not None else State.zero_init(params.domain)
u = init_u(params) if init_u is not None else State.zero_init(params.domain)
return cls(u=u, v=v, h=h)
@staticmethod
def zero_init(domain):
return jnp.zeros_like(domain.grid[..., 0])
File: ~/code_projects/jaxsw/jaxsw/_src/models/sw/__init__.py
Type: type
Subclasses: Domain
For the domain, we will use a generic domain for each of the variables.
dx = dy = 5e3
Lx = 200 * dx
Ly = 104 * dy


domain = Domain(xmin=(0, 0), xmax=(Lx, Ly), dx=(dx, dy))

print(f"Nx: {domain.Nx}")
print(f"Lx: {domain.Lx}")
print(f"dx: {domain.dx}")
print(f"Size: {domain.size}")
print(f"nDims: {domain.ndim}")
print(f"Grid Size: {domain.grid.shape}")
print(f"Cell Volume: {domain.cell_volume:_}")
Nx: (201, 105)
Lx: (1000000.0, 520000.0)
dx: (5000.0, 5000.0)
Size: (201, 105)
nDims: 2
Grid Size: (201, 105, 2)
Cell Volume: 25_000_000.0
Initial Condition
Note: The initial condition depends on a few parameters that will also be used in other examples. So we can make the parameters container to hold all of the parameters needed.
SWMParams??Init signature:
SWMParams(
domain: jaxsw._src.domain.base.Domain,
depth: float,
gravity: float,
coriolis_f0: float,
coriolis_beta: float,
)
Docstring: Params(domain, depth, gravity, coriolis_f0, coriolis_beta)
Source:
class Params(tp.NamedTuple):
domain: Domain
depth: float
gravity: float
coriolis_f0: float # or ARRAY
coriolis_beta: float # or ARRAY
@property
def phase_speed(self):
return jnp.sqrt(self.gravity * self.depth)
def rossby_radius(self, domain):
return self.phase_speed / self.coriolis_param(domain).mean()
# return self.phase_speed / self.coriolis_f0
def coriolis_param(self, domain):
return self.coriolis_f0 + domain.grid[..., 1] * self.coriolis_beta
def lateral_viscosity(self, domain):
return 1e-3 * self.coriolis_f0 * domain.dx[0] ** 2
File: ~/code_projects/jaxsw/jaxsw/_src/models/sw/__init__.py
Type: type
Subclasses: def init_u0(params):
domain = params.domain
# grab coordinate values
y = domain.coords[1]
# grab grid coordinate values
Y = domain.grid[..., 1]
# grab number of points - y direction
n_y = domain.Nx[1]
# grabs physical length of domain - x direction
l_x = domain.Lx[0]
# makes a Gaussian Ridge?
u0 = 10 * np.exp(-((Y - y[n_y // 2]) ** 2) / (0.02 * l_x) ** 2)
return jnp.asarray(u0)
def init_h0(params):
# parse parameters and domain
domain = params.domain
dy = domain.dx[1]
coriolis_param = params.coriolis_param(domain)
gravity = params.gravity
depth = params.depth
# grab grid coordinate values
X, Y = domain.grid[..., 0], domain.grid[..., 1]
# grab number of points - y direction
n_y = domain.Nx[1]
# grabs physical length of domain - x direction
l_x, l_y = domain.Lx
u0 = init_u0(params)
# approximate balance h_y = -(f/g)u
h0 = jnp.cumsum(-dy * u0 * coriolis_param / gravity, axis=1)
# remove mean (make sure h0 is centered around depth)
h0 -= h0.mean()
# add depth
h0 += depth
# add small perturbation
h0 += 0.2 * jnp.sin(X / l_x * 10 * jnp.pi) * jnp.cos(Y / l_y * 8 * jnp.pi)
# boundaries of H must not be used!
h0 = h0.at[0, :].set(jnp.nan)
h0 = h0.at[-1, :].set(jnp.nan)
h0 = h0.at[:, 0].set(jnp.nan)
h0 = h0.at[:, -1].set(jnp.nan)
return jnp.asarray(h0)params = SWMParams(
depth=100.0, gravity=9.81, coriolis_f0=2e-4, coriolis_beta=2e-11, domain=domain
)
h0 = init_h0(params)
u0 = init_u0(params)fig, ax = plt.subplots(ncols=2, figsize=(10, 5))
ax[0].imshow(h0.T, origin="lower", cmap="RdBu_r")
ax[0].set(title="h")
ax[1].imshow(u0.T, origin="lower", cmap="RdBu_r")
ax[1].set(title="u-velocity")
plt.tight_layout()
plt.show()
Equation of Motion
try:
    ds_results = xr.load_dataset("./sw_linear_jet_.nc")
    state_init = SWMState(
        u=jnp.asarray(ds_results.u.isel(time=-1)),
        v=jnp.asarray(ds_results.v.isel(time=-1)),
        h=jnp.asarray(ds_results.h.isel(time=-1)),
    )

except:
    state_init = SWMState.init_state(params, init_h=init_h0, init_u=init_u0)
fig, ax = plt.subplots(ncols=3, figsize=(10, 5))
ax[0].imshow(state_init.h.T, origin="lower", cmap="RdBu_r")
ax[0].set(title="h")
ax[1].imshow(state_init.u.T, origin="lower", cmap="RdBu_r")
ax[1].set(title="u-velocity")
ax[2].imshow(state_init.v.T, origin="lower", cmap="RdBu_r")
ax[2].set(title="v-velocity")
plt.tight_layout()
plt.show()
state_update = LinearShallowWater2D.equation_of_motion(0, state_init, params)fig, ax = plt.subplots(ncols=3, figsize=(10, 5))
ax[0].imshow(state_update.h.T, origin="lower", cmap="RdBu_r")
ax[0].set(title="h")
ax[1].imshow(state_update.u.T, origin="lower", cmap="RdBu_r")
ax[1].set(title="u-velocity")
ax[2].imshow(state_update.v.T, origin="lower", cmap="RdBu_r")
ax[2].set(title="v-velocity")
plt.tight_layout()
plt.show()
Time Stepping
# TEMPORAL DISCRETIZATION
# initialize temporal domain

dt = 0.125 * domain.dx[0] / np.sqrt(params.gravity * params.depth)
print(f"Step Size (dt): {dt:.4e}")

tmin = 0.0
tmax = pd.to_timedelta(2.0, unit="days").total_seconds()
num_save = 100
Step Size (dt): 1.9955e+01
import pandas as pdt_domain = TimeDomain(tmin=tmin, tmax=tmax, dt=dt)
ts = jnp.linspace(tmin, tmax, num_save)
saveat = dfx.SaveAt(ts=ts)
# DYNAMICAL SYSTEM
dyn_model = LinearShallowWater2D(t_domain=t_domain, saveat=saveat)Integration
%%time
# Euler, Constant StepSize
solver = dfx.Dopri5()

# Tolerances
stepsize_controller = dfx.ConstantStepSize()
# rtol = 1e-3
# atol = 1e-4
# stepsize_controller = dfx.PIDController(
#     pcoeff=0.3, icoeff=0.4, rtol=rtol, atol=atol, dtmax=dt
# )

# SPATIAL DISCRETIZATION
params_init = SWMParams(
    depth=100.0, gravity=9.81, coriolis_f0=2e-4, coriolis_beta=2e-11, domain=domain
)
try:
    ds_results = xr.load_dataset("./sw_linear_jet_.nc")
    state_init = SWMState(
        u=jnp.asarray(ds_results.u.isel(time=-1)),
        v=jnp.asarray(ds_results.v.isel(time=-1)),
        h=jnp.asarray(ds_results.h.isel(time=-1)),
    )

except:
    state_init = SWMState.init_state(params, init_h=init_h0, init_u=init_u0)


# integration
sol = dfx.diffeqsolve(
    terms=dfx.ODETerm(dyn_model.equation_of_motion),
    solver=solver,
    t0=ts.min(),
    t1=ts.max(),
    dt0=dt,
    y0=state_init,
    saveat=saveat,
    args=params_init,
    stepsize_controller=stepsize_controller,
    max_steps=None,
)
CPU times: user 30 s, sys: 595 ms, total: 30.6 s
Wall time: 29.8 s
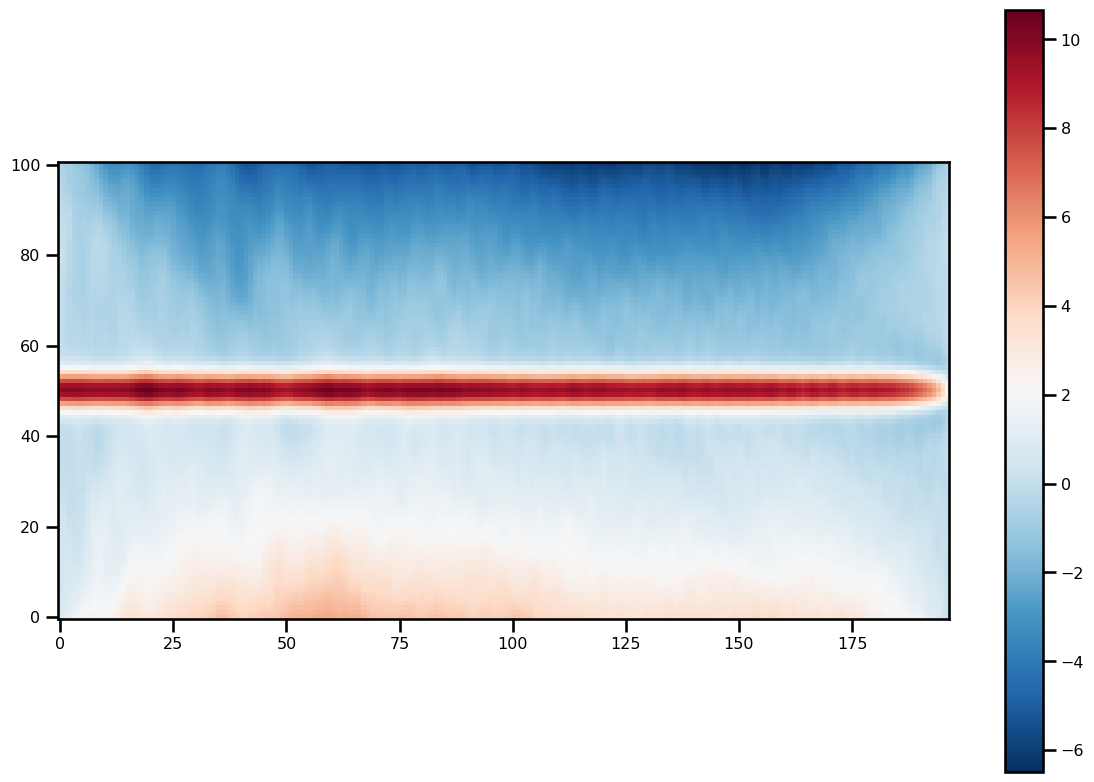
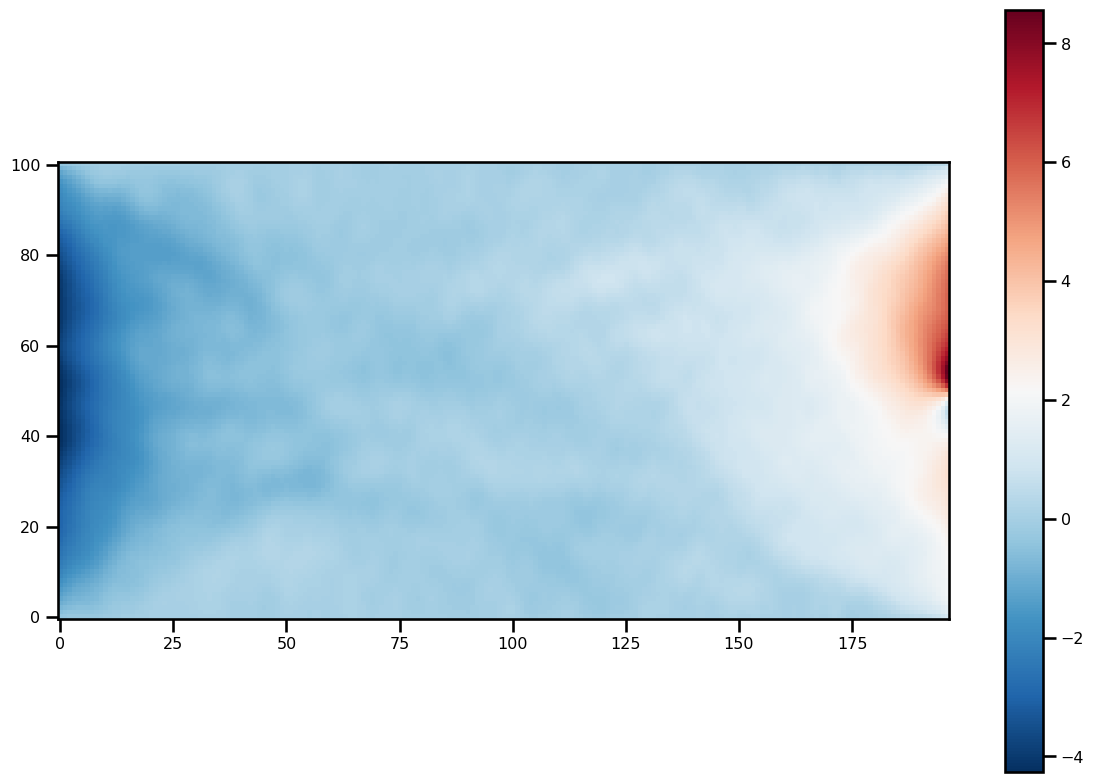
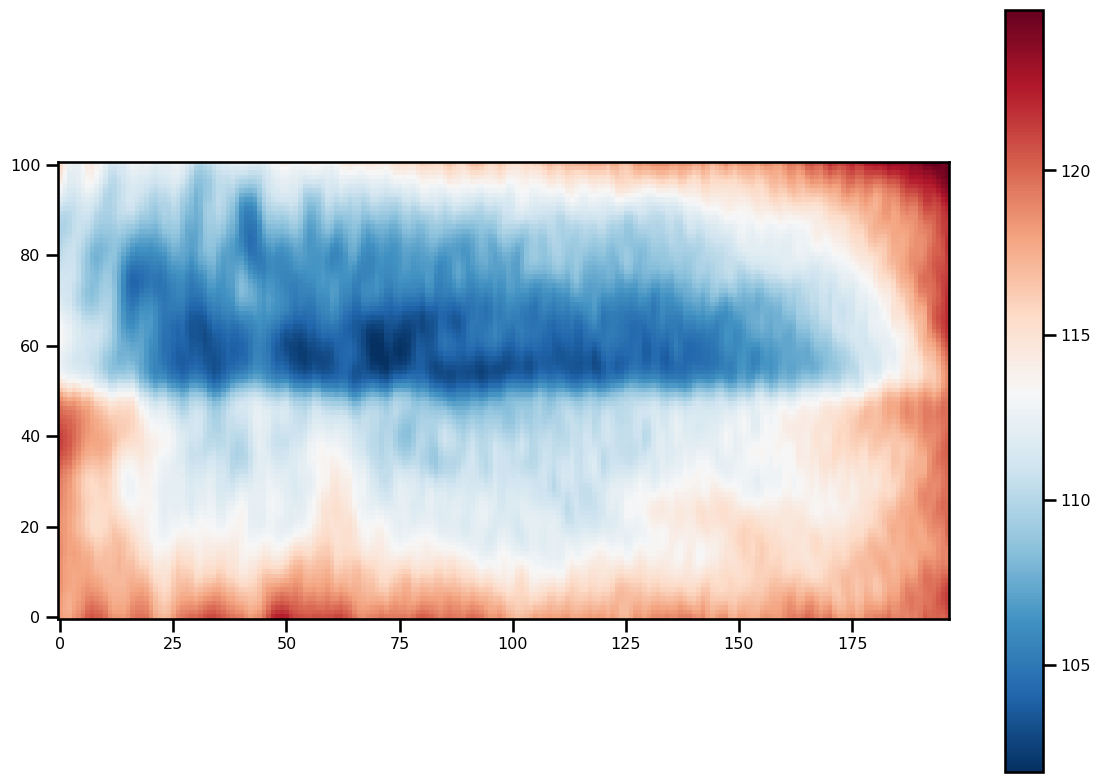
for ivar in sol.ys:
    fig, ax = plt.subplots(figsize=(12, 8))
    pts = ax.imshow(ivar[-1][2:-2, 2:-2].T, origin="lower", cmap="RdBu_r")
    plt.colorbar(pts)
    plt.tight_layout()


Analysis
ds_results = xr.Dataset(
    data_vars={
        "u": (("time", "x", "y"), sol.ys.u),
        "v": (("time", "x", "y"), sol.ys.v),
        "h": (("time", "x", "y"), sol.ys.h),
    },
    coords={
        "time": (("time"), sol.ts),
        "x": (("x"), domain.coords[0]),
        "y": (("y"), domain.coords[1]),
    },
)
ds_results
Loading...
# ds_results.to_netcdf("./sw_linear_jet.nc")from xmovie import Movie
from pathlib import Path
from matplotlib import ticker
from xmovie import Movie
from pathlib import Path
from matplotlib import ticker
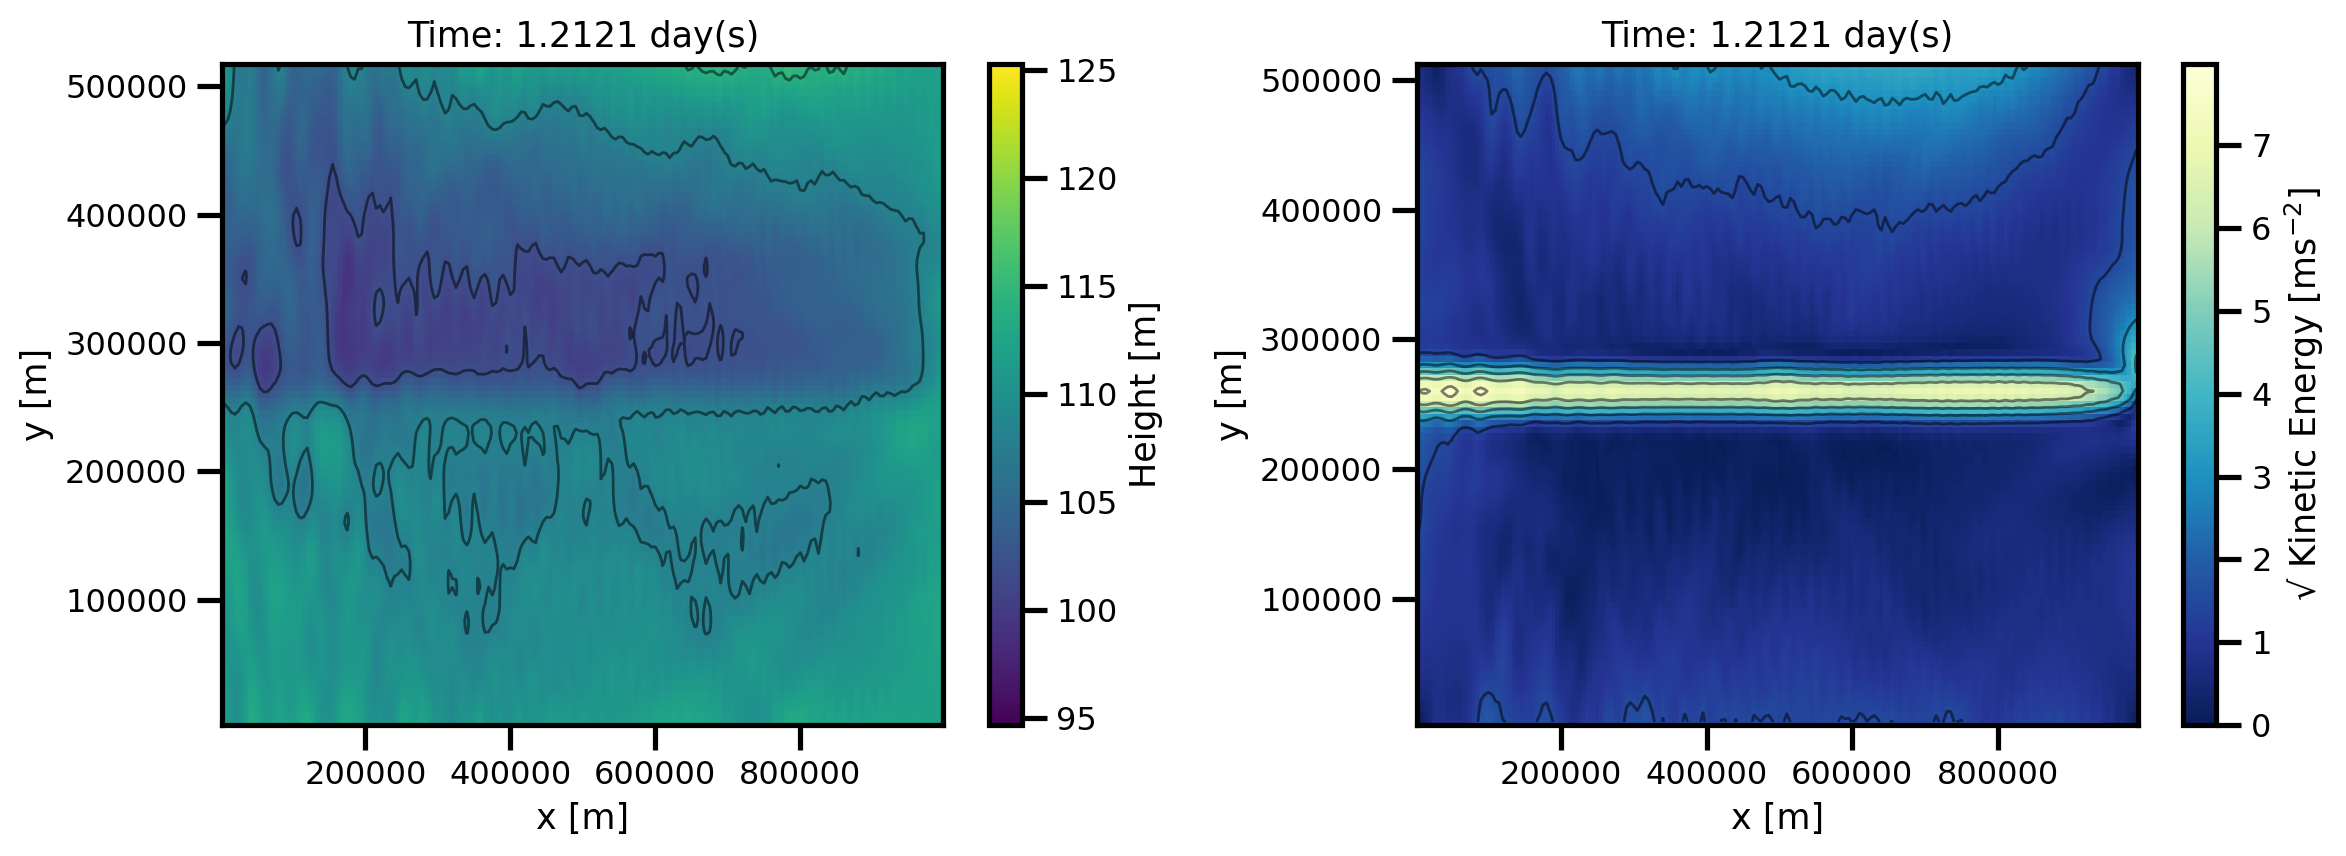
def custom_plot_h_ke_layers(ds, fig, tt, *args, **kwargs):
sub = ds.isel(time=tt)
time = sub.v.time.values / 86400
xlim = kwargs.pop("xlim", None)
ylim = kwargs.pop("ylim", None)
vmin_h = kwargs.pop("vmin_h", sub.h.isel(x=slice(1, -1), y=slice(1, -1)).min())
vmax_h = kwargs.pop("vmax_h", sub.h.isel(x=slice(1, -1), y=slice(1, -1)).max())
cmap = kwargs.pop("cmap", "viridis")
fig.set_size_inches(12, 4.5)
ax = fig.subplots(
ncols=2,
)
# HEIGHT
cbar_kwargs = {"label": "Height [m]"}
pts = sub.h.isel(x=slice(1, -1), y=slice(1, -1)).plot.pcolormesh(
ax=ax[0],
cmap="viridis",
add_colorbar=True,
vmin=vmin_h,
vmax=vmax_h,
cbar_kwargs=cbar_kwargs,
# **kwargs
)
loc = ticker.MaxNLocator(6)
levels = loc.tick_values(vmin_h, vmax_h)
sub.h.isel(x=slice(1, -1), y=slice(1, -1)).plot.contour(
ax=ax[0],
levels=levels,
vmin=vmin_h,
vmax=vmax_h,
alpha=0.5,
linewidths=1,
cmap="black",
linestyles=np.where(levels >= 0, "-", "--"),
)
# ax.set_aspect('equal')
pts = ax[0].set(xlabel="x [m]", ylabel="y [m]", title=f"Time: {time:.4f} day(s)")
# U-VELOCITY
cbar_kwargs = {"label": "√ Kinetic Energy [ms$^{-2}$]"}
vmin_ke = kwargs.pop("vmin_ke", sub.ke.isel(x=slice(1, -1), y=slice(1, -1)).min())
vmax_ke = kwargs.pop("vmax_ke", sub.ke.isel(x=slice(1, -1), y=slice(1, -1)).max())
pts = sub.ke.isel(x=slice(1, -2), y=slice(1, -2)).plot.pcolormesh(
ax=ax[1],
cmap="YlGnBu_r",
add_colorbar=True,
vmin=vmin_ke,
vmax=vmax_ke,
cbar_kwargs=cbar_kwargs
# **kwargs
)
loc = ticker.MaxNLocator(6)
levels = loc.tick_values(vmin_ke, vmax_ke)
sub.ke.isel(x=slice(1, -2), y=slice(1, -2)).plot.contour(
ax=ax[1],
levels=levels,
vmin=vmin_ke,
vmax=vmax_ke,
alpha=0.5,
linewidths=1,
cmap="black",
linestyles=np.where(levels >= 0, "-", "--"),
)
# ax.set_aspect('equal')
pts = ax[1].set(xlabel="x [m]", ylabel="y [m]", title=f"Time: {time:.4f} day(s)")
plt.tight_layout()
return None, None
from pathlib import Path
def create_movie(
var,
name,
plotfunc=custom_plot_h_ke_layers,
framedim: str = "steps",
file_path=None,
**kwargs,
):
if file_path is not None:
file_name = Path(file_path).joinpath(f"movie_{name}.gif")
else:
file_name = Path(f"./movie_{name}.gif")
mov = Movie(
var, plotfunc=plotfunc, framedim=framedim, **kwargs, dpi=200, input_check=False
)
mov.save(
file_name,
remove_movie=False,
progress=True,
framerate=3,
gif_framerate=3,
overwrite_existing=True,
gif_resolution_factor=0.5,
parallel=False,
)
return None%matplotlib inline
vmin_h = ds_results.h.isel(x=slice(2, -2), y=slice(2, -2)).min()
vmax_h = ds_results.h.isel(x=slice(2, -2), y=slice(2, -2)).max()
ds_results["ke"] = np.sqrt(0.5 * (ds_results.u**2 + ds_results.v**2))
vmin_ke = ds_results.ke.isel(x=slice(2, -2), y=slice(2, -2)).min()
vmax_ke = ds_results.ke.isel(x=slice(2, -2), y=slice(2, -2)).max()
mov = Movie(
ds_results.transpose("time", "y", "x"),
plotfunc=custom_plot_h_ke_layers,
framedim="time",
input_check=False,
vmin_h=vmin_h,
vmax_h=vmax_h,
vmin_ke=vmin_ke,
vmax_ke=vmax_ke,
)
mov.preview(60)
# create_movie(
#     ds_results.transpose(
#         "time", "y", "x"
#     ),  # .sel(time=slice("2017-02-01", "2017-03-01")),
#     name="swe_linear_jet",
#     plotfunc=custom_plot_h_ke_layers,
#     file_path="./",
#     framedim="time",
#     cmap="viridis",
#     robust=True,
#     vmin_h=vmin_h,
#     vmax_h=vmax_h,
#     vmin_ke=vmin_ke,
#     vmax_ke=vmax_ke,
# )
Loading...