3 Layer Stacked QG Model
import autoroot
import jax
import jax.numpy as jnp
import jax.scipy as jsp
from jax.config import config
import numpy as np
import numba as nb
import pandas as pd
import equinox as eqx
import finitediffx as fdx
import diffrax as dfx
import xarray as xr
import einops
import matplotlib.pyplot as plt
import seaborn as sns
from einops import rearrange, repeat, reduce
from tqdm.notebook import tqdm, trange
from jaxtyping import Array, Float

from jaxsw._src.domain.base import Domain
from jaxsw._src.operators.functional import advection as F_adv
from jaxsw._src.operators.functional import geostrophic as F_geos
from jaxsw._src.operators.functional import cgrid as F_cgrid
from jaxsw._src.operators.functional import grid as F_grid
from jaxsw._src.boundaries.helmholtz import enforce_boundaries_helmholtz
from jaxsw._src.models import qg_louis as F_louis
from jaxsw._src.models import qg_ml as F_qgml

sns.reset_defaults()
sns.set_context(context="talk", font_scale=0.7)
config.update("jax_enable_x64", True)


%matplotlib inline
%load_ext autoreload
%autoreload 2
/Users/eman/miniconda3/envs/jaxsw/lib/python3.11/site-packages/equinox/_ad.py:733: UserWarning: As of Equinox 0.10.7, `equinox.filter_custom_vjp.defvjp` is deprecated in favour of `.def_fwd` and `.def_bwd`. This new API supports symbolic zeros, which allow for more efficient autodifferentiation rules. In particular:
- the fwd and bwd functions take an extra `perturbed` argument, which indicates which primals actually need a gradient. You can use this to skip computing the gradient for any unperturbed value. (You can also safely just ignore this if you wish.)
- `None` was previously passed to indicate a symbolic zero gradient for all objects that weren't inexact arrays, but all inexact arrays always had an array-valued gradient. Now, `None` may also be passed to indicate that an inexact array has a symbolic zero gradient.
warnings.warn(
from loguru import logger


def plot_field(field):
    num_axis = len(field)
    fig, ax = plt.subplots(ncols=num_axis, figsize=(8, 3))

    for i in range(num_axis):
        pts = ax[i].pcolormesh(field[i], cmap="coolwarm")
        plt.colorbar(pts)

    plt.tight_layout()
    plt.show()


def print_debug_quantity(quantity, name=""):
    size = quantity.shape
    min_ = np.min(quantity)
    max_ = np.max(quantity)
    mean_ = np.mean(quantity)
    median_ = np.mean(quantity)
    logger.debug(
        f"{name}: {size} | {min_:.6e} | {mean_:.6e} | {median_:.6e} | {max_:.6e}"
    )
In this problem, we are looking at sea surface height (SSH) in relation to the Quasi-Geostrophic (QG) equations. These equations are a simplified form for the Navier-Stokes equations with approximations like hydrostatic approximation, small aspect ratio, and a small Rossby number. Ideally, these equations might be a decent approximation at mesoscale (100km - 10,000km). In this application, we will see how SSH propagates with the QG equations.
Equations
The term that links each of the layers together, , is a tri-diagonal matrix that can be written as
In the paper [Thiry et al., 2023], they use the following method
Source:
Parameters
a_4 = 5.0e11  # 2.0e9 #
params = F_qgml.PDEParams(a_4=a_4)
Domain
# Low Resolution
Nx, Ny = 97, 121
# High Resolution
# Nx, Ny = 769, 961

Lx, Ly = 3840.0e3, 4800.0e3

# initialize domain
domain = Domain.from_numpoints(xmin=(0, 0), xmax=(Lx, Ly), N=(Nx, Ny))
domain.dx, domain.Nx, domain.Lx, domain.cell_volume, domain.ndim((40000.0, 40000.0), (97, 121), (3840000.0, 4800000.0), 1600000000.0, 2)# # initialize domain
# # domain = Domain.from_numpoints(xmin=(0, 0), xmax=(Lx, Ly), N=(Nx+1, Ny+1))
# domain = F_qgml.Domain(nx=Nx, ny=Ny, Lx=Lx, Ly=Ly)
# domain.dxHeights
from jaxsw._src.domain.qg import LayerDomain

# heights
heights = [350.0, 750.0, 2900.0]

# reduced gravities
reduced_gravities = [0.025, 0.0125]

layer_domain = LayerDomain(heights, reduced_gravities)layer_domain.AArray([[ 0.11428571, -0.11428571, 0. ],
[-0.05333333, 0.16 , -0.10666667],
[ 0. , -0.02758621, 0.02758621]], dtype=float64)layer_domain.lambd, layer_domain.A_layer_2_mode, layer_domain.A_mode_2_layer(Array([ 2.28183707e-01, 7.36882145e-02, -4.04361683e-18], dtype=float64),
Array([[-0.43193138, 0.92242719, -0.49049581],
[-0.65802762, -0.50089268, 1.15892029],
[-0.15155445, -0.32475953, -1.25573684]], dtype=float64),
Array([[-0.70499319, -0.92396019, -0.57735027],
[ 0.70260146, -0.32821664, -0.57735027],
[-0.09662189, 0.19639605, -0.57735027]], dtype=float64))Helmholtz Matrices
from jaxsw._src.operators.functional import elliptical as F_ellipticallayer_domain.lambdArray([ 2.28183707e-01, 7.36882145e-02, -4.04361683e-18], dtype=float64)# create Helmholtz Matrix
helmoltz_dst_mat = F_qgml.create_qgml_helmholtz_matrix(
domain, layer_domain.lambd, params.f0
)
print_debug_quantity(helmoltz_dst_mat[0], "helmholtz")
print_debug_quantity(helmoltz_dst_mat[1], "helmholtz")
print_debug_quantity(helmoltz_dst_mat[2], "helmholtz")2023-07-12 18:47:29.460 | DEBUG | __main__:print_debug_quantity:22 - helmholtz: (95, 119) | -7.969477e-01 | -5.126282e-01 | -5.126282e-01 | -2.283086e-01
2023-07-12 18:47:29.462 | DEBUG | __main__:print_debug_quantity:22 - helmholtz: (95, 119) | -6.424522e-01 | -3.581327e-01 | -3.581327e-01 | -7.381310e-02
2023-07-12 18:47:29.464 | DEBUG | __main__:print_debug_quantity:22 - helmholtz: (95, 119) | -5.687640e-01 | -2.844445e-01 | -2.844445e-01 | -1.248847e-04
plot_field(helmoltz_dst_mat)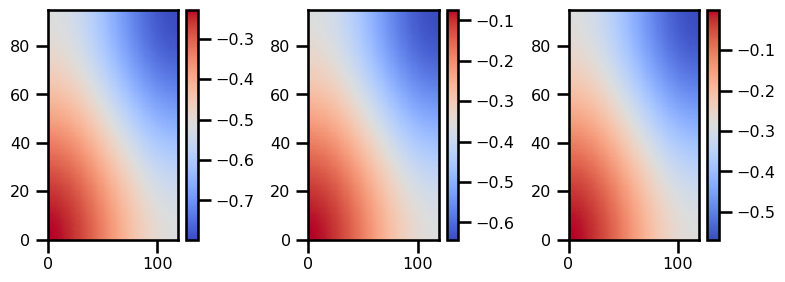
Inversion
We are interested in solving for the Helmholtz equation which is given by
helmoltz_dst_mat.shape(3, 95, 119)Homogeneous Solution
First, we need to use the scheme to solve the homogeneous Helmholtz equation for the baroclinic nodes. The homoegeneous equation is given by:
Let's reformulate the pressure to be:
where is a known solution of the Laplace's equation with non-zero boundaries.
which is non
homogeneous_sol = F_qgml.helmholtz_homogeneous_sol_multilayer(
    helmoltz_dst_mat, layer_domain.lambd, domain
)
print_debug_quantity(homogeneous_sol)
2023-07-12 18:47:30.258 | DEBUG | __main__:print_debug_quantity:22 - : (2, 97, 121) | -3.576361e-12 | 4.449322e-06 | 4.449322e-06 | 8.520065e-05
plot_field(homogeneous_sol)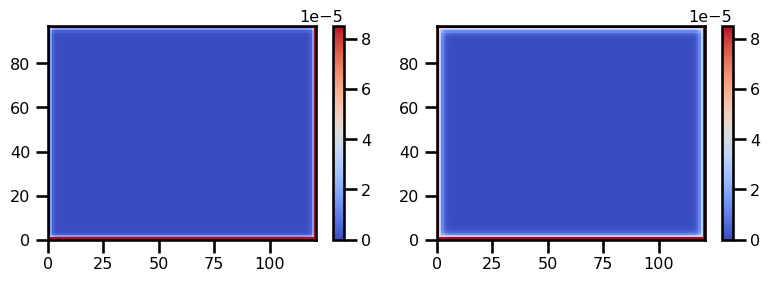
Alpha Matrix
alpha_matrix = F_qgml.compute_alpha_matrix(layer_domain.A_mode_2_layer, homogeneous_sol)

print_debug_quantity(alpha_matrix)
2023-07-12 18:47:30.618 | DEBUG | __main__:print_debug_quantity:22 - : (2, 2) | -2.558977e+05 | -1.140663e+05 | -1.140663e+05 | 2.813377e-11
Forcing
from jaxsw._src.forcing import wind as F_wind

tau = F_wind.init_tau(domain, tau0=2.0e-5)
print_debug_quantity(tau, "Tau")
wind_forcing = F_wind.calculate_wind_forcing(tau, domain) / (params.f0 * heights[0])
print_debug_quantity(wind_forcing, "wind_forcing")
2023-07-12 18:47:30.658 | DEBUG | __main__:print_debug_quantity:22 - Tau: (2, 97, 121) | -1.999326e-05 | 3.348584e-22 | 3.348584e-22 | 2.000000e-05
2023-07-12 18:47:31.571 | DEBUG | __main__:print_debug_quantity:22 - wind_forcing: (95, 119) | -7.905821e-10 | 4.311263e-13 | 4.311263e-13 | 7.905821e-10
def calculate_wind_forcing(tau, domain):
    # move from edges to nodes
    tau_x = F_grid.x_average_2D(tau[0])
    tau_y = F_grid.y_average_2D(tau[1])

    # calculate curl
    dF2dX = (tau_y[1:] - tau_y[:-1]) / domain.dx[0]
    dF1dY = (tau_x[:, 1:] - tau_x[:, :-1]) / domain.dx[1]
    curl_stagg = dF2dX - dF1dY

    # move from nodes to faces
    return F_grid.center_average_2D(curl_stagg)


wind_forcing = calculate_wind_forcing(tau, domain)
fig, ax = plt.subplots()
pts = ax.pcolormesh(wind_forcing)
plt.colorbar(pts)
plt.tight_layout()
plt.show()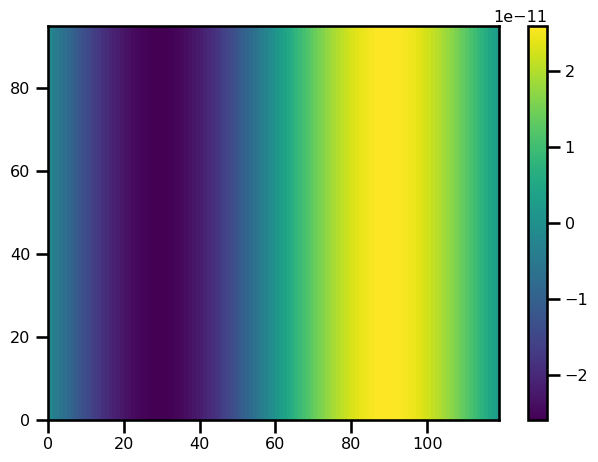
Pressure
if domain.Nx[0] == 97:
    p = np.load("./p_380yrs_HRDS.npy", allow_pickle=True).astype(np.float64)
else:
    p = jnp.zeros_like(domain.grid[..., 0])
    p = einops.repeat(p, "i j -> 3 i j")
p.shape
(3, 97, 121)Vorticity
import functools as ft

bc_fn = ft.partial(F_qgml.custom_boundaries, constant=params.zfbc)
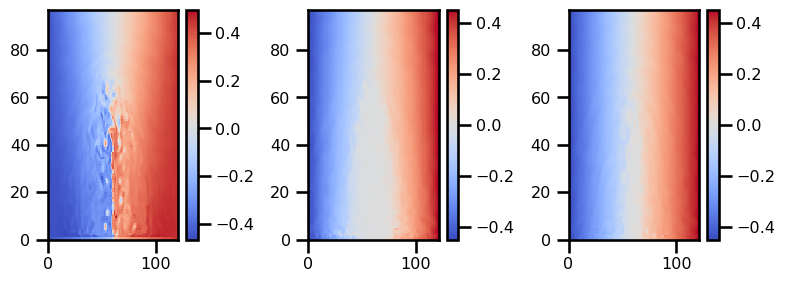
q = F_qgml.pressure_to_vorticity(jnp.asarray(p), bc_fn, layer_domain.A, params, domain)
print_debug_quantity(p, "PRESSURE")
print_debug_quantity(q, "VORTICITY")
2023-07-12 18:47:33.131 | DEBUG | __main__:print_debug_quantity:22 - PRESSURE: (3, 97, 121) | -4.332182e+00 | 3.335592e-02 | 3.335592e-02 | 3.561408e+00
2023-07-12 18:47:33.167 | DEBUG | __main__:print_debug_quantity:22 - VORTICITY: (3, 97, 121) | -4.657202e-01 | -6.053233e-06 | -6.053233e-06 | 4.963626e-01
plot_field(p)
plot_field(q)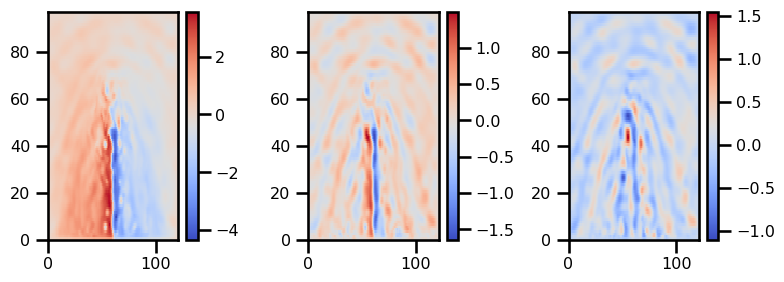
RHS
from jaxsw._src.operators.functional.advection import det_jacobianrhs_advection = (1 / params.f0) * det_jacobian(q, p, domain.dx[0], domain.dx[1])
print_debug_quantity(p, "PRESSURE")
print_debug_quantity(q, "VORTICITY")
print_debug_quantity(rhs_advection, "RHS ADVECTION")2023-07-12 18:47:33.874 | DEBUG | __main__:print_debug_quantity:22 - PRESSURE: (3, 97, 121) | -4.332182e+00 | 3.335592e-02 | 3.335592e-02 | 3.561408e+00
2023-07-12 18:47:33.876 | DEBUG | __main__:print_debug_quantity:22 - VORTICITY: (3, 97, 121) | -4.657202e-01 | -6.053233e-06 | -6.053233e-06 | 4.963626e-01
2023-07-12 18:47:33.919 | DEBUG | __main__:print_debug_quantity:22 - RHS ADVECTION: (3, 95, 119) | -1.564097e-06 | -2.804566e-12 | -2.804566e-12 | 1.195297e-06
plot_field(rhs_advection)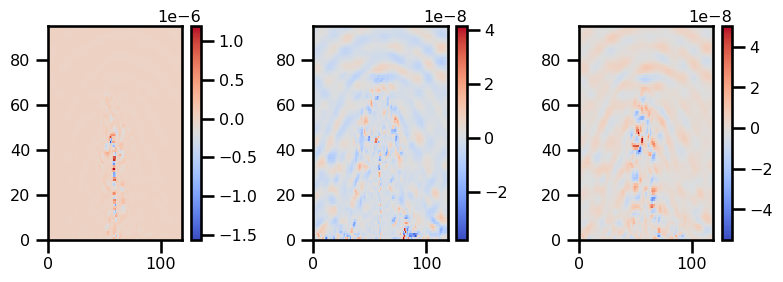
print_debug_quantity(p, "PRESSURE")
rhs = F_qgml.rhs_pde(
    q, jnp.asarray(p), bc_fn, params, layer_domain, domain, wind_forcing
)
print_debug_quantity(rhs, "RHS")
2023-07-12 18:47:34.327 | DEBUG | __main__:print_debug_quantity:22 - PRESSURE: (3, 97, 121) | -4.332182e+00 | 3.335592e-02 | 3.335592e-02 | 3.561408e+00
2023-07-12 18:47:34.706 | DEBUG | __main__:print_debug_quantity:22 - RHS: (3, 95, 119) | -1.502200e-06 | -7.205300e-12 | -7.205300e-12 | 1.339382e-06
plot_field(rhs)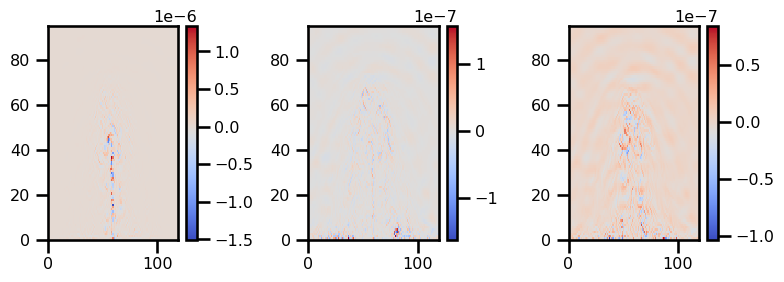
Time Step
import typing as tp


class QGState(tp.NamedTuple):
    q: Array
    p: Array


class QGARGS(tp.NamedTuple):
    params: tp.NamedTuple
    domain: Domain
    layer_domain: LayerDomain
    wind_forcing: Array
    helmoltz_dst_mat: Array
    alpha_matrix: Array
    homogeneous_sol: Array
    bc_fn: tp.Callable
if domain.Nx[0] == 97:
p = jnp.asarray(
np.load("./p_380yrs_HRDS.npy", allow_pickle=True).astype(np.float64)
)
else:
p = jnp.zeros_like(domain.grid[..., 0])
p = einops.repeat(p, "i j -> 3 i j")
import functools as ft
bc_fn = ft.partial(F_qgml.custom_boundaries, constant=params.zfbc)
q = F_qgml.pressure_to_vorticity(jnp.asarray(p), bc_fn, layer_domain.A, params, domain)
state_init = F_qgml.QGState(p=p, q=q)
args = F_qgml.QGARGS(
domain=domain,
layer_domain=layer_domain,
wind_forcing=wind_forcing,
helmoltz_dst_mat=helmoltz_dst_mat,
alpha_matrix=alpha_matrix,
homogeneous_sol=homogeneous_sol,
bc_fn=bc_fn,
)import typing as tp
def pde_time_step(t, state, args):
# unpack state
p, q = state.p, state.q
# RHS of PDE for Q (INTERIOR)
dq_f0 = F_qgml.rhs_pde(
q,
p,
bc_fn=bc_fn,
params=args.params,
layer_domain=args.layer_domain,
domain=args.domain,
wind_forcing=args.wind_forcing,
)
print_debug_quantity(dq_f0, "dq_f0")
# pad for original domain
dq_f0 = jnp.pad(dq_f0, ((0, 0), (1, 1), (1, 1)))
# PRESSURE (INTERIOR)
rhs_helmholtz = jnp.einsum("ij,jkl->ikl", args.layer_domain.A_layer_2_mode, dq_f0)
print_debug_quantity(rhs_helmholtz, "rhs_helmholtz")
dp_modes = jax.vmap(F_elliptical.inverse_elliptic_dst, in_axes=(0, 0))(
rhs_helmholtz[:, 1:-1, 1:-1], args.helmoltz_dst_mat
)
dp_modes = jnp.pad(dp_modes, ((0, 0), (1, 1), (1, 1)))
print_debug_quantity(dp_modes, "dp_modes")
# ensure mass conservation
print_debug_quantity(args.alpha_matrix, "alpha_matrix")
dalpha = args.alpha_matrix @ dp_modes[..., :-1, :, :].mean((-2, -1))
dalpha = einops.repeat(dalpha, "i -> i 1 1")
print_debug_quantity(dalpha, "dalpha")
print_debug_quantity(args.homogeneous_sol, "homogeneous_sol")
dp_modes = dp_modes.at[..., :-1, :, :].set(
dp_modes[..., :-1, :, :] + dalpha * args.homogeneous_sol
)
print_debug_quantity(dp_modes, "dp_modes")
dp = jnp.einsum("ij,jkl->ikl", args.layer_domain.A_mode_2_layer, dp_modes)
print_debug_quantity(dp, "dp")
delta_p_boundaries = args.bc_fn(dp / (params.f0 * args.domain.dx[0]) ** 2)
print_debug_quantity(delta_p_boundaries, "delta_p_boundaries")
# apply boundaries
print(delta_p_boundaries.shape, args.layer_domain.A.shape, dp.shape)
dq_f0_boundaries = delta_p_boundaries - jnp.einsum(
"ij,jkl->ikl", args.layer_domain.A, dp
)
dq_f0 = F_qgml.apply_boundaries(dq_f0, dq_f0_boundaries)
return dp, q
out_state = F_qgml.pde_time_step(p, q, params, args)
print_debug_quantity(out_state[0], "dp")
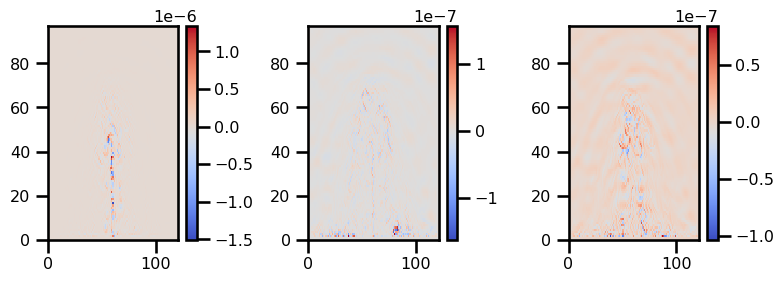
print_debug_quantity(out_state[1], "dq_f0")2023-07-12 18:47:35.234 | DEBUG | __main__:print_debug_quantity:22 - dp: (3, 97, 121) | -5.185125e-06 | 2.919435e-08 | 2.919435e-08 | 5.175048e-06
2023-07-12 18:47:35.235 | DEBUG | __main__:print_debug_quantity:22 - dq_f0: (3, 97, 121) | -1.502200e-06 | -8.966964e-12 | -8.966964e-12 | 1.339382e-06
plot_field(out_state[0])
plot_field(out_state[1])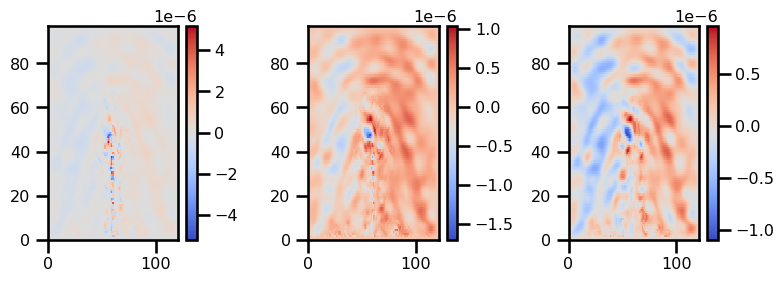
pde_args = QGARGS(
    params=params,
    domain=domain,
    layer_domain=layer_domain,
    wind_forcing=wind_forcing,
    helmoltz_dst_mat=helmoltz_dst_mat,
    alpha_matrix=alpha_matrix,
    homogeneous_sol=homogeneous_sol,
    bc_fn=bc_fn,
)

pde_time_step_fn = ft.partial(F_qgml.pde_time_step, params=params, args=pde_args)

rhs_time_step_jitted = jax.jit(pde_time_step_fn)


# vector field
def vector_field(t, state, args):
    p, q = state
    p, q = rhs_time_step_jitted(p, q)

    return (p, q)


if domain.Nx[0] == 97:
    p = np.load("./p_380yrs_HRDS.npy", allow_pickle=True).astype(np.float64)
else:
    p = jnp.zeros_like(domain.grid[..., 0])
    p = einops.repeat(p, "i j -> 3 i j")


bc_fn = ft.partial(F_qgml.custom_boundaries, constant=params.zfbc)
q = F_qgml.pressure_to_vorticity(jnp.asarray(p), bc_fn, layer_domain.A, params, domain)
dp, dq = vector_field(0, (p, q), None)
print_debug_quantity(dp, "dp")
print_debug_quantity(dq, "dq_f0")2023-07-12 18:57:12.848 | DEBUG | __main__:print_debug_quantity:22 - dp: (3, 97, 121) | -5.185125e-06 | 2.919435e-08 | 2.919435e-08 | 5.175048e-06
2023-07-12 18:57:12.848 | DEBUG | __main__:print_debug_quantity:22 - dq_f0: (3, 97, 121) | -1.502200e-06 | -8.966964e-12 | -8.966964e-12 | 1.339382e-06
Time Stepping
We're going to use the Heun method.
I'll also be using diffrax to handle the time stepping :)
dt = 1_200  # LR #600 # HR #
n_years = 2
n_days = 365
tmin = 0
tmax = pd.to_timedelta(n_years * n_days, unit="day").total_seconds()
ts = jnp.arange(tmin, tmax, dt)len(ts)52560if domain.Nx[0] == 97:
p = np.load("./p_380yrs_HRDS.npy", allow_pickle=True).astype(np.float64)
else:
p = jnp.zeros_like(domain.grid[..., 0])
p = einops.repeat(p, "i j -> 3 i j")
bc_fn = ft.partial(F_qgml.custom_boundaries, constant=params.zfbc)
q = F_qgml.pressure_to_vorticity(jnp.asarray(p), bc_fn, layer_domain.A, params, domain)
state = (p, q)
solver = dfx.Heun()
solver_state = solver.init(
terms=dfx.ODETerm(vector_field),
t0=tmax,
t1=tmin + dt,
y0=state,
args=None,
)n_check = 2_000
freq_log = 1_000 # LR #50 # HR #
n_check2000saved_states = dict(q=list(), p=list(), t=list())
solver_step = jax.jit(solver.step, static_argnames=("made_jump", "terms"))
with tqdm(ts) as pbar:
for t in pbar:
state, _, _, solver_state, _ = solver_step(
terms=dfx.ODETerm(vector_field),
t0=t,
t1=t + dt,
y0=state,
args=None,
solver_state=solver_state,
made_jump=False,
)
msg1 = f"PRESSURE: {jnp.min(state[0]):.4e} | {jnp.max(state[0]):.4e}"
msg2 = f"VORTICITY: {jnp.min(state[1]):.4e} | {jnp.max(state[1]):.4e}"
pbar.set_description(msg1 + " - " + msg2)
if t % (freq_log * dt) == 0:
saved_states["q"].append(state[1])
saved_states["p"].append(state[0])
saved_states["t"].append(t)Analysis
import xarray as xr


ds_results = xr.Dataset(
    data_vars={
        "q": (("time", "layer", "x", "y"), np.stack(saved_states["q"], axis=0)),
        "p": (("time", "layer", "x", "y"), np.stack(saved_states["p"], axis=0)),
    },
    coords={
        "time": (("time"), np.stack(saved_states["t"], axis=0)),
        "layer": (("layer"), np.arange(3)),
        "x": (("x"), np.arange(0, domain.Lx[0] + 1, domain.dx[0])),
        "y": (("y"), np.arange(0, domain.Lx[1] + 1, domain.dx[1])),
    },
)
ds_resultsfrom xmovie import Movie
from pathlib import Path
from matplotlib import ticker
def custom_plot_p_layers(ds, fig, tt, *args, **kwargs):
sub = ds.isel(time=tt)
xlim = kwargs.pop("xlim", None)
ylim = kwargs.pop("ylim", None)
vmin = kwargs.pop("vmin", sub.p.min())
vmax = kwargs.pop("vmax", sub.p.max())
cmap = kwargs.pop("cmap", "viridis")
fig.set_size_inches(15, 10)
ax = fig.subplots(ncols=3, nrows=2)
for i in range(3):
# NATL60
pts = sub.p.isel(layer=i).plot.pcolormesh(
ax=ax[0, i],
cmap="viridis",
add_colorbar=True,
vmin=vmin,
vmax=vmax,
# **kwargs
)
loc = ticker.MaxNLocator(6)
levels = loc.tick_values(vmin, vmax)
sub.p.isel(layer=i).plot.contour(
ax=ax[0, i],
levels=levels,
vmin=vmin,
vmax=vmax,
alpha=0.5,
linewidths=1,
cmap="black",
linestyles=np.where(levels >= 0, "-", "--"),
)
# ax.set_aspect('equal')
pts = ax[0, i].set(xlabel="x [m]", ylabel="y [m]", title=f"Layer {i}")
xlim = kwargs.pop("xlim", None)
ylim = kwargs.pop("ylim", None)
vmin = kwargs.pop("vmin", sub.q.min())
vmax = kwargs.pop("vmax", sub.q.max())
cmap = kwargs.pop("cmap", "viridis")
for i in range(3):
# NATL60
pts = sub.q.isel(layer=i).plot.pcolormesh(
ax=ax[1, i],
cmap="RdBu_r",
add_colorbar=True,
vmin=vmin,
vmax=vmax,
# **kwargs
)
loc = ticker.MaxNLocator(6)
levels = loc.tick_values(vmin, vmax)
sub.q.isel(layer=i).plot.contour(
ax=ax[1, i],
levels=levels,
vmin=vmin,
vmax=vmax,
alpha=0.5,
linewidths=1,
cmap="black",
linestyles=np.where(levels >= 0, "-", "--"),
)
# ax.set_aspect('equal')
pts = ax[0, i].set(xlabel="x [m]", ylabel="y [m]", title=f"Layer {i}")
plt.tight_layout()
return None, None
from pathlib import Path
def create_movie(
var,
name,
plotfunc=custom_plot_p_layers,
framedim: str = "steps",
file_path=None,
**kwargs,
):
if file_path is not None:
file_name = Path(file_path).joinpath(f"movie_{name}.gif")
else:
file_name = Path(f"./movie_{name}.gif")
mov = Movie(
var, plotfunc=plotfunc, framedim=framedim, **kwargs, dpi=200, input_check=False
)
mov.save(
file_name,
remove_movie=False,
progress=True,
framerate=3,
gif_framerate=3,
overwrite_existing=True,
gif_resolution_factor=0.5,
parallel=False,
)
return None%matplotlib inline
mov = Movie(
ds_results.transpose("time", "layer", "y", "x"),
plotfunc=custom_plot_p_layers,
framedim="time",
input_check=False,
)
mov.preview(5)/var/folders/k9/_v6ywhvj0nq36tpttd3j4mq80000gn/T/ipykernel_71303/2500604652.py:78: UserWarning: The figure layout has changed to tight
plt.tight_layout()
/var/folders/k9/_v6ywhvj0nq36tpttd3j4mq80000gn/T/ipykernel_71303/2500604652.py:78: UserWarning: The figure layout has changed to tight
plt.tight_layout()
/var/folders/k9/_v6ywhvj0nq36tpttd3j4mq80000gn/T/ipykernel_71303/2500604652.py:78: UserWarning: The figure layout has changed to tight
plt.tight_layout()
/var/folders/k9/_v6ywhvj0nq36tpttd3j4mq80000gn/T/ipykernel_71303/2500604652.py:78: UserWarning: The figure layout has changed to tight
plt.tight_layout()
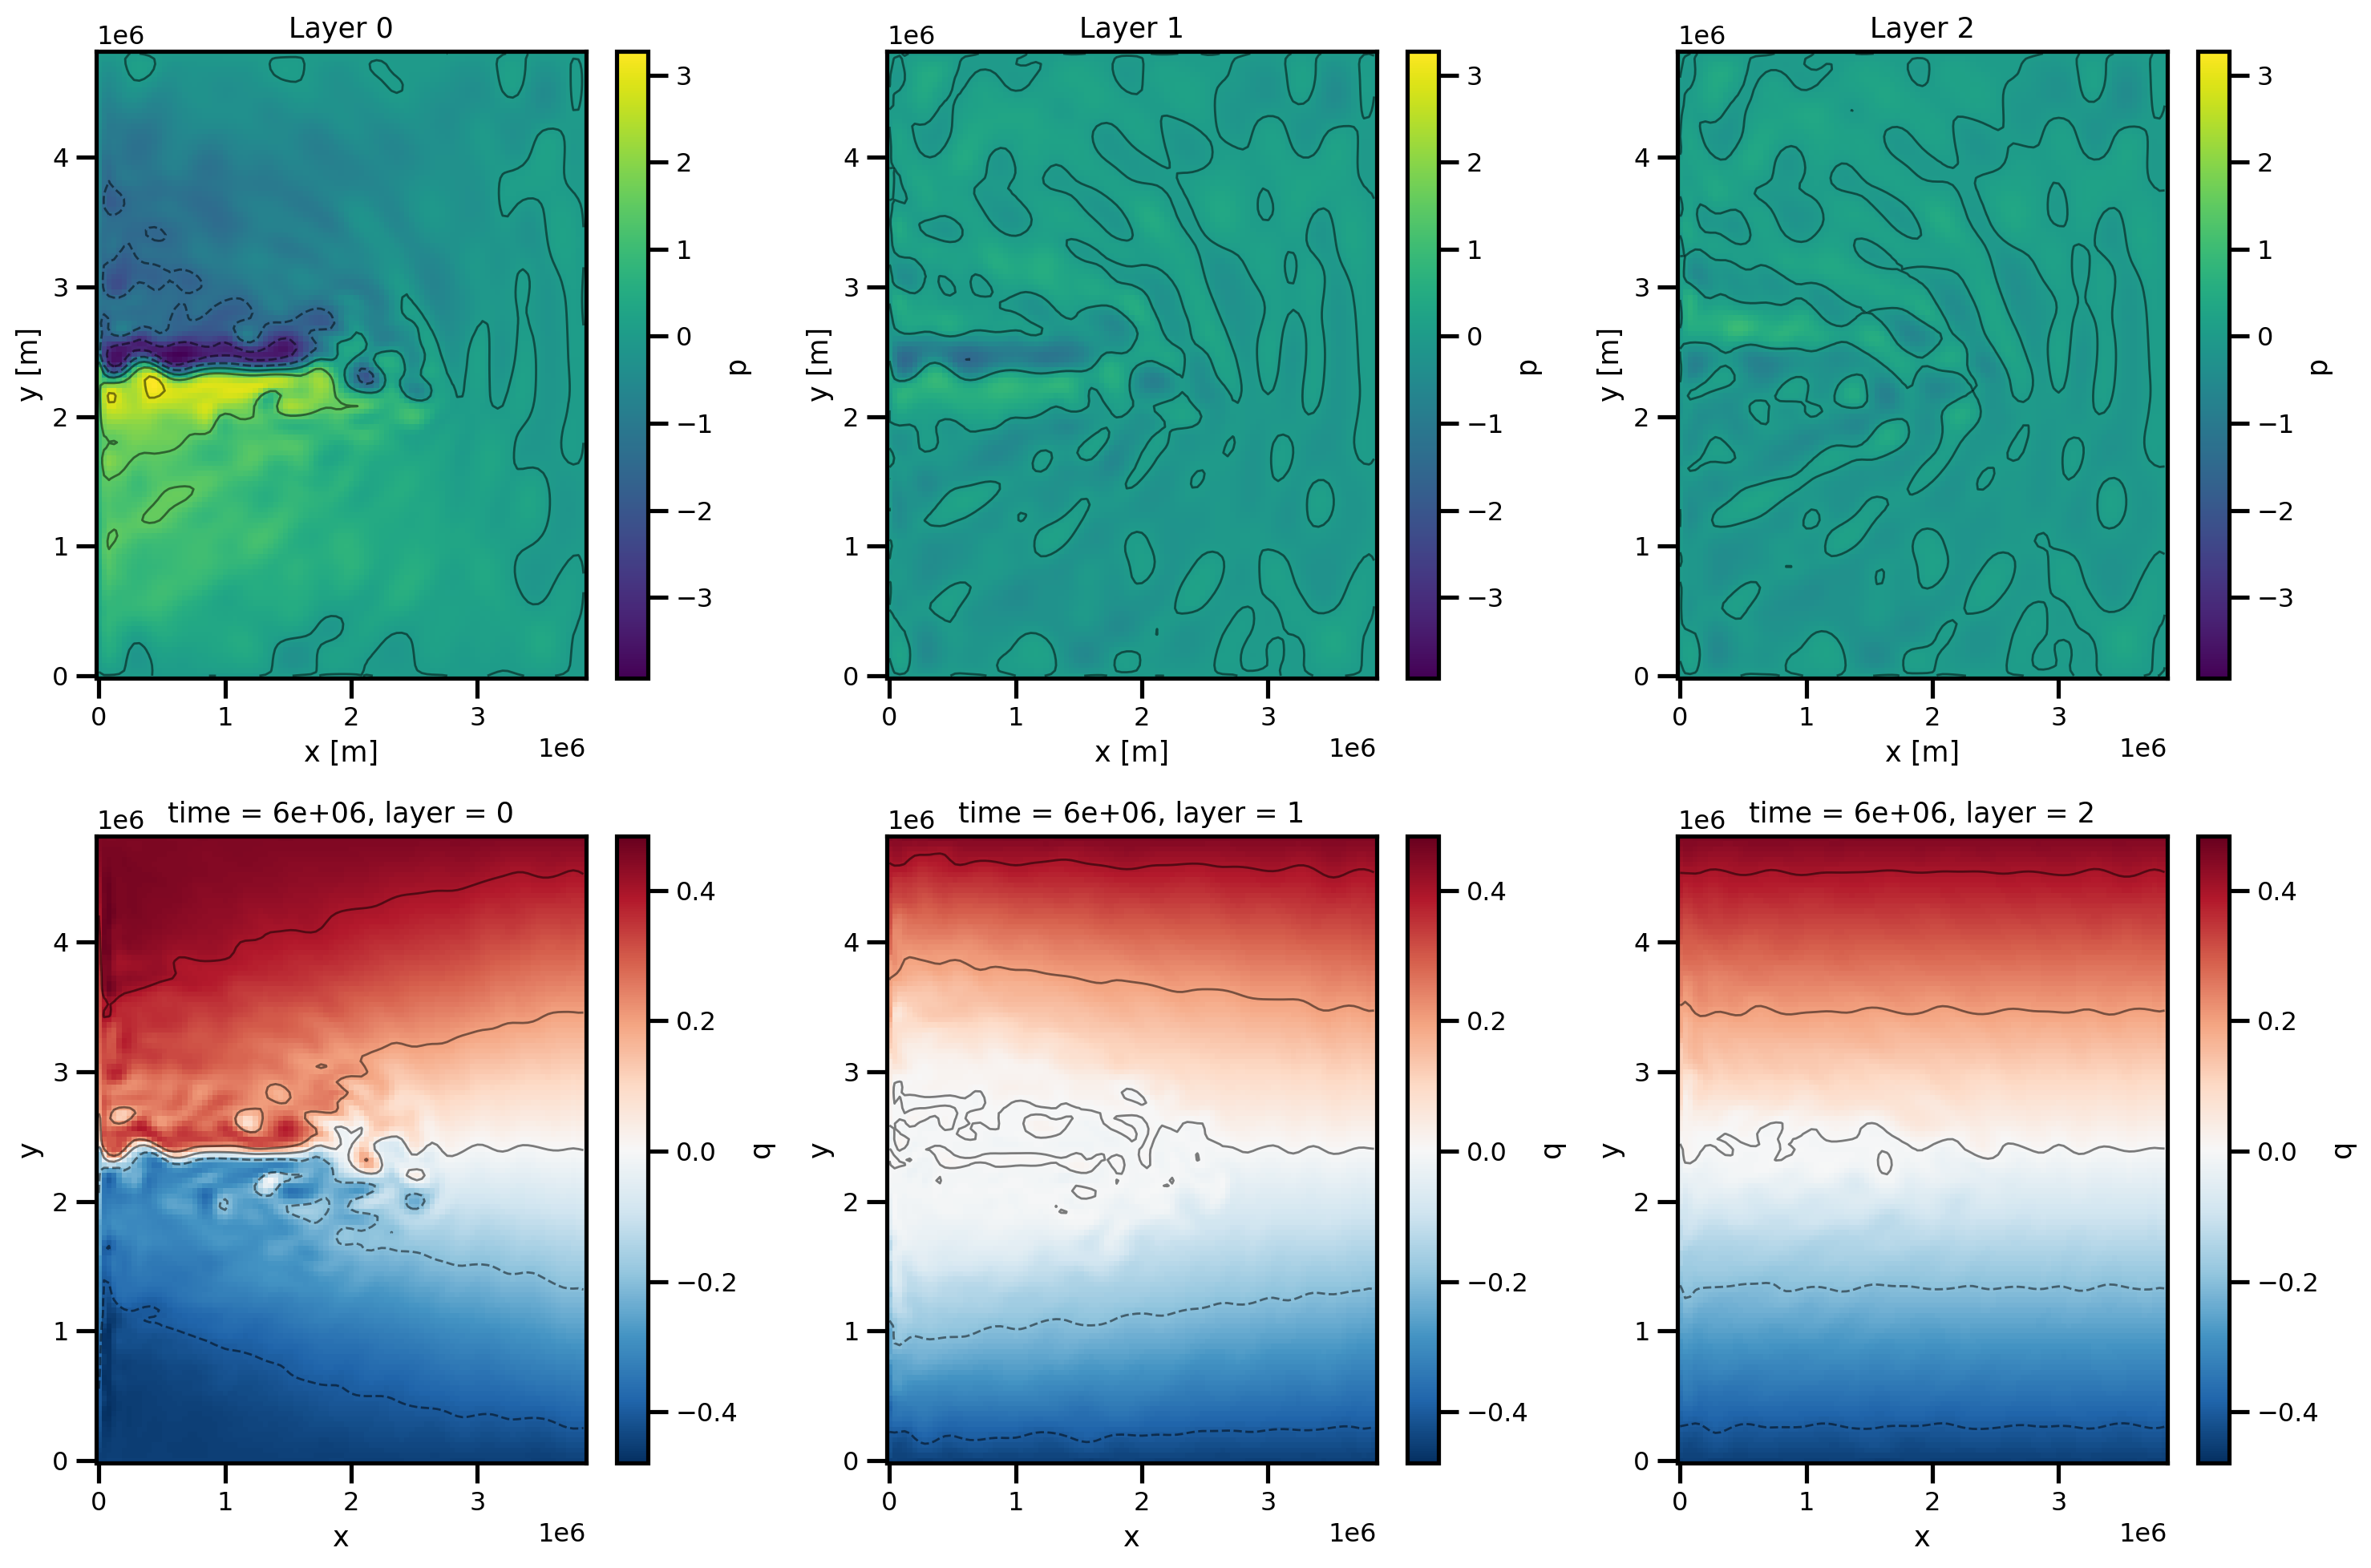
create_movie(
    ds_results.transpose(
        "time", "layer", "y", "x"
    ),  # .sel(time=slice("2017-02-01", "2017-03-01")),
    name="pressure_vorticity_v2",
    plotfunc=custom_plot_p_layers,
    file_path="./",
    framedim="time",
    cmap="viridis",
    robust=True,
)- Thiry, L., Li, L., Roullet, G., & Mémin, E. (2023). Finite-volume discretization of the quasi-geostrophic equations with implicit dissipation. 10.22541/essoar.167397445.54992823/v1
- Pedlosky, J. (1987). Geophysical Fluid Dynamics. Springer New York. 10.1007/978-1-4612-4650-3
- Vallis, G. K. (2017). Atmospheric and Oceanic Fluid Dynamics. Cambridge University Press. 10.1017/9781107588417