Experiment - RBIG Sample Consistency#
import sys, os
from pyprojroot import here

# spyder up to find the root
pysim_root = "/home/emmanuel/code/pysim"
rbig_root = "/home/emmanuel/code/rbig"
# append to path
sys.path.append(str(rbig_root))
sys.path.append(str(pysim_root))

import numpy as np

# MATPLOTLIB Settings
import matplotlib as mpl
import matplotlib.pyplot as plt

%matplotlib inline
%config InlineBackend.figure_format = 'retina'

# SEABORN SETTINGS
import seaborn as sns
import corner

sns.set_context(context="poster", font_scale=0.7)

%load_ext autoreload
%autoreload 2
%load_ext lab_black
Mutual Information#
# ==========================
# INITIALIZE LOGGER
# ==========================
import wandb

wandb_logger = wandb.init(project="rbig4it", entity="ipl_uv")
Failed to detect the name of this notebook, you can set it manually with the WANDB_NOTEBOOK_NAME environment variable to enable code saving.
wandb: Currently logged in as: ml4floods (use `wandb login --relogin` to force relogin)
wandb: wandb version 0.10.31 is available!  To upgrade, please run:
wandb:  $ pip install wandb --upgrade
Tracking run with wandb version 0.10.30
Syncing run charmed-brook-1 to Weights & Biases (Documentation).
Project page: https://wandb.ai/ipl_uv/rbig4it
Run page: https://wandb.ai/ipl_uv/rbig4it/runs/ep72ky8b
Run data is saved locally in
Syncing run charmed-brook-1 to Weights & Biases (Documentation).
Project page: https://wandb.ai/ipl_uv/rbig4it
Run page: https://wandb.ai/ipl_uv/rbig4it/runs/ep72ky8b
Run data is saved locally in
/home/emmanuel/documents/research_notebook/research_notebook/content/notes/info_theory/experiments/wandb/run-20210609_001640-ep72ky8bDataset#
from pysim.data.information.gaussian import (
    generate_gaussian_data,
    generate_gaussian_rotation_data,
)
from pysim.data.information.linear import generate_linear_entropy_data
from pysim.data.information.studentt import generate_studentt_data
from functools import partial
from pysim.information.entropy import marginal_entropy
from pysim.information.histogram import hist_entropy
from typing import NamedTuple


def get_tc_datasets(n_samples, n_features, seed, dataset="gaussian", **kwargs):

    if dataset == "gaussian":

        res = generate_gaussian_data(
            n_samples=n_samples,
            n_features=n_features,
            seed=seed,
            n_base_samples=500_000,
        )

    elif dataset == "gaussian_rotation":

        res = generate_gaussian_rotation_data(
            n_samples=n_samples,
            n_features=n_features,
            seed=seed,
            n_base_samples=500_000,
        )

    elif dataset == "linear_rotation":

        f = partial(marginal_entropy, estimator=hist_entropy, bins="sqrt")

        res = generate_linear_entropy_data(
            n_samples=n_samples,
            n_features=n_features,
            seed=seed,
            marg_h_estimator=f,
            estimator_name="histogram",
            n_base_samples=500_000,
        )
    elif dataset == "studentt":

        res = generate_studentt_data(
            n_samples=n_samples,
            n_features=n_features,
            seed=seed,
            n_base_samples=500_000,
            df=kwargs.get("df", 3.0),
        )

    elif dataset == "cauchy":

        res = generate_studentt_data(
            n_samples=n_samples,
            n_features=n_features,
            seed=seed,
            n_base_samples=500_000,
            df=1.0,
        )

    else:
        raise ValueError(f"Unrecognized dataset.")

    return res
datasets = [
    "gaussian",
    "gaussian_rotation",
    "linear_rotation",
    "studentt",
    "cauchy",
]
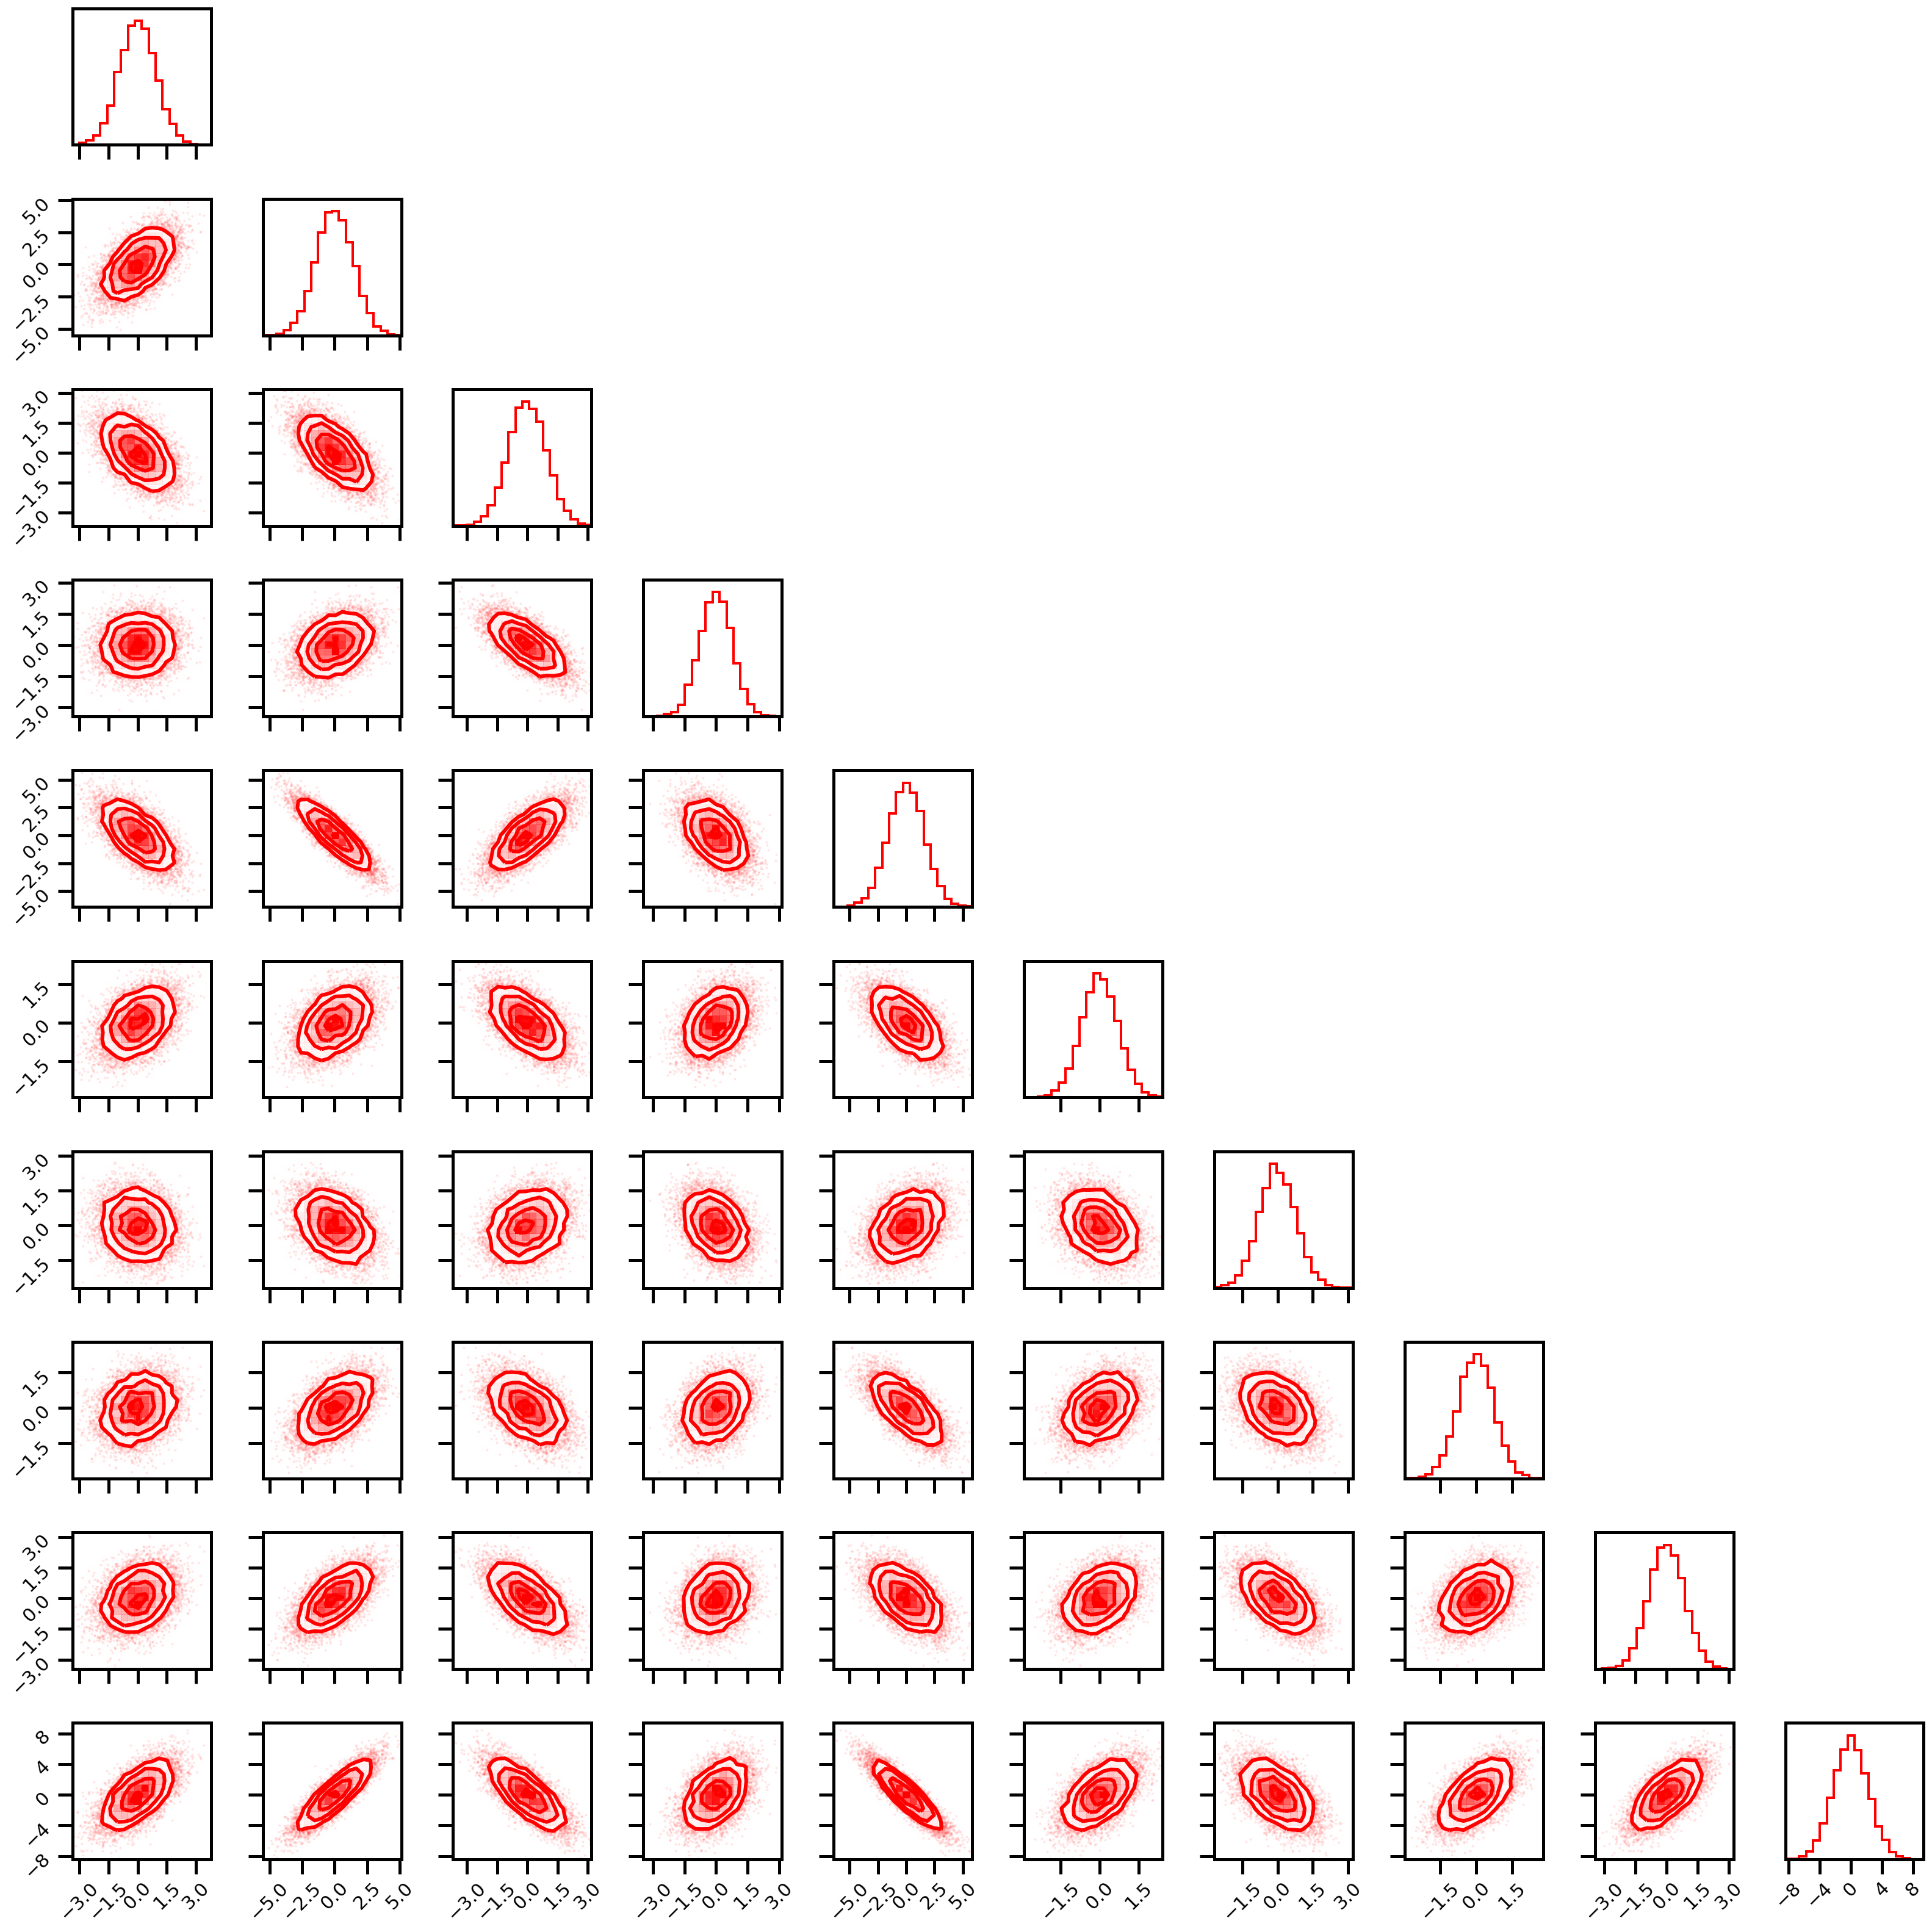
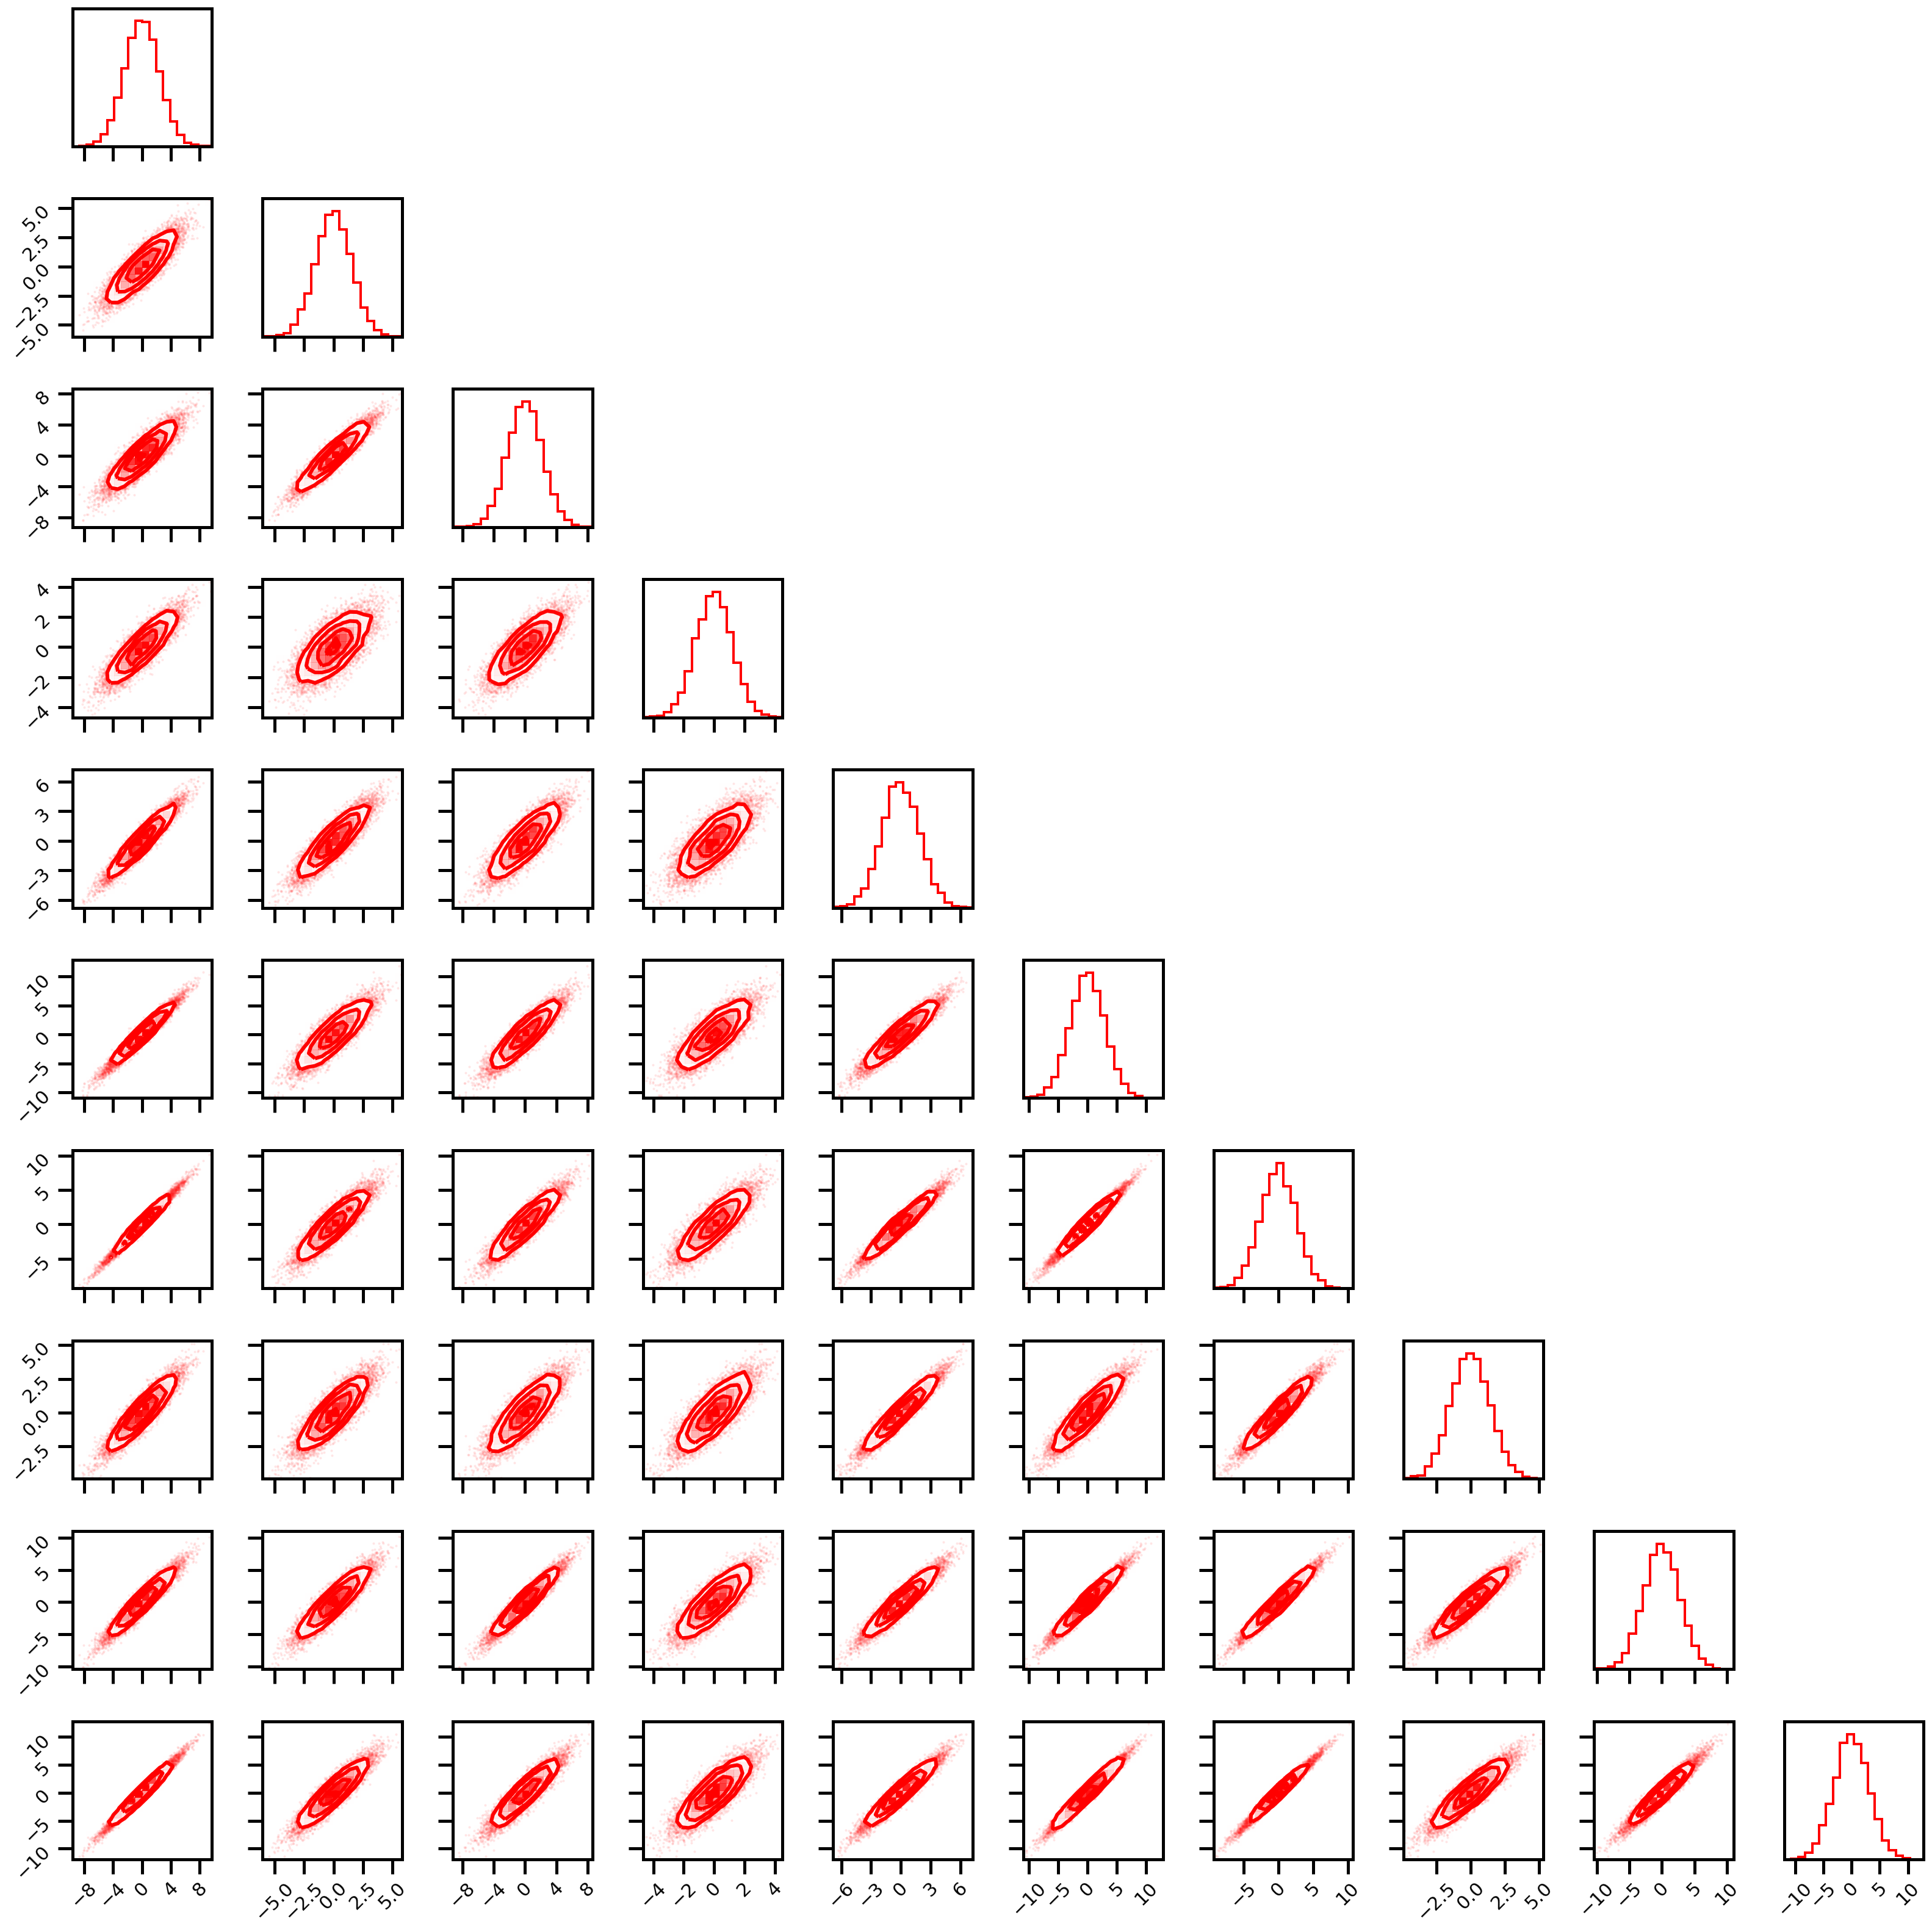
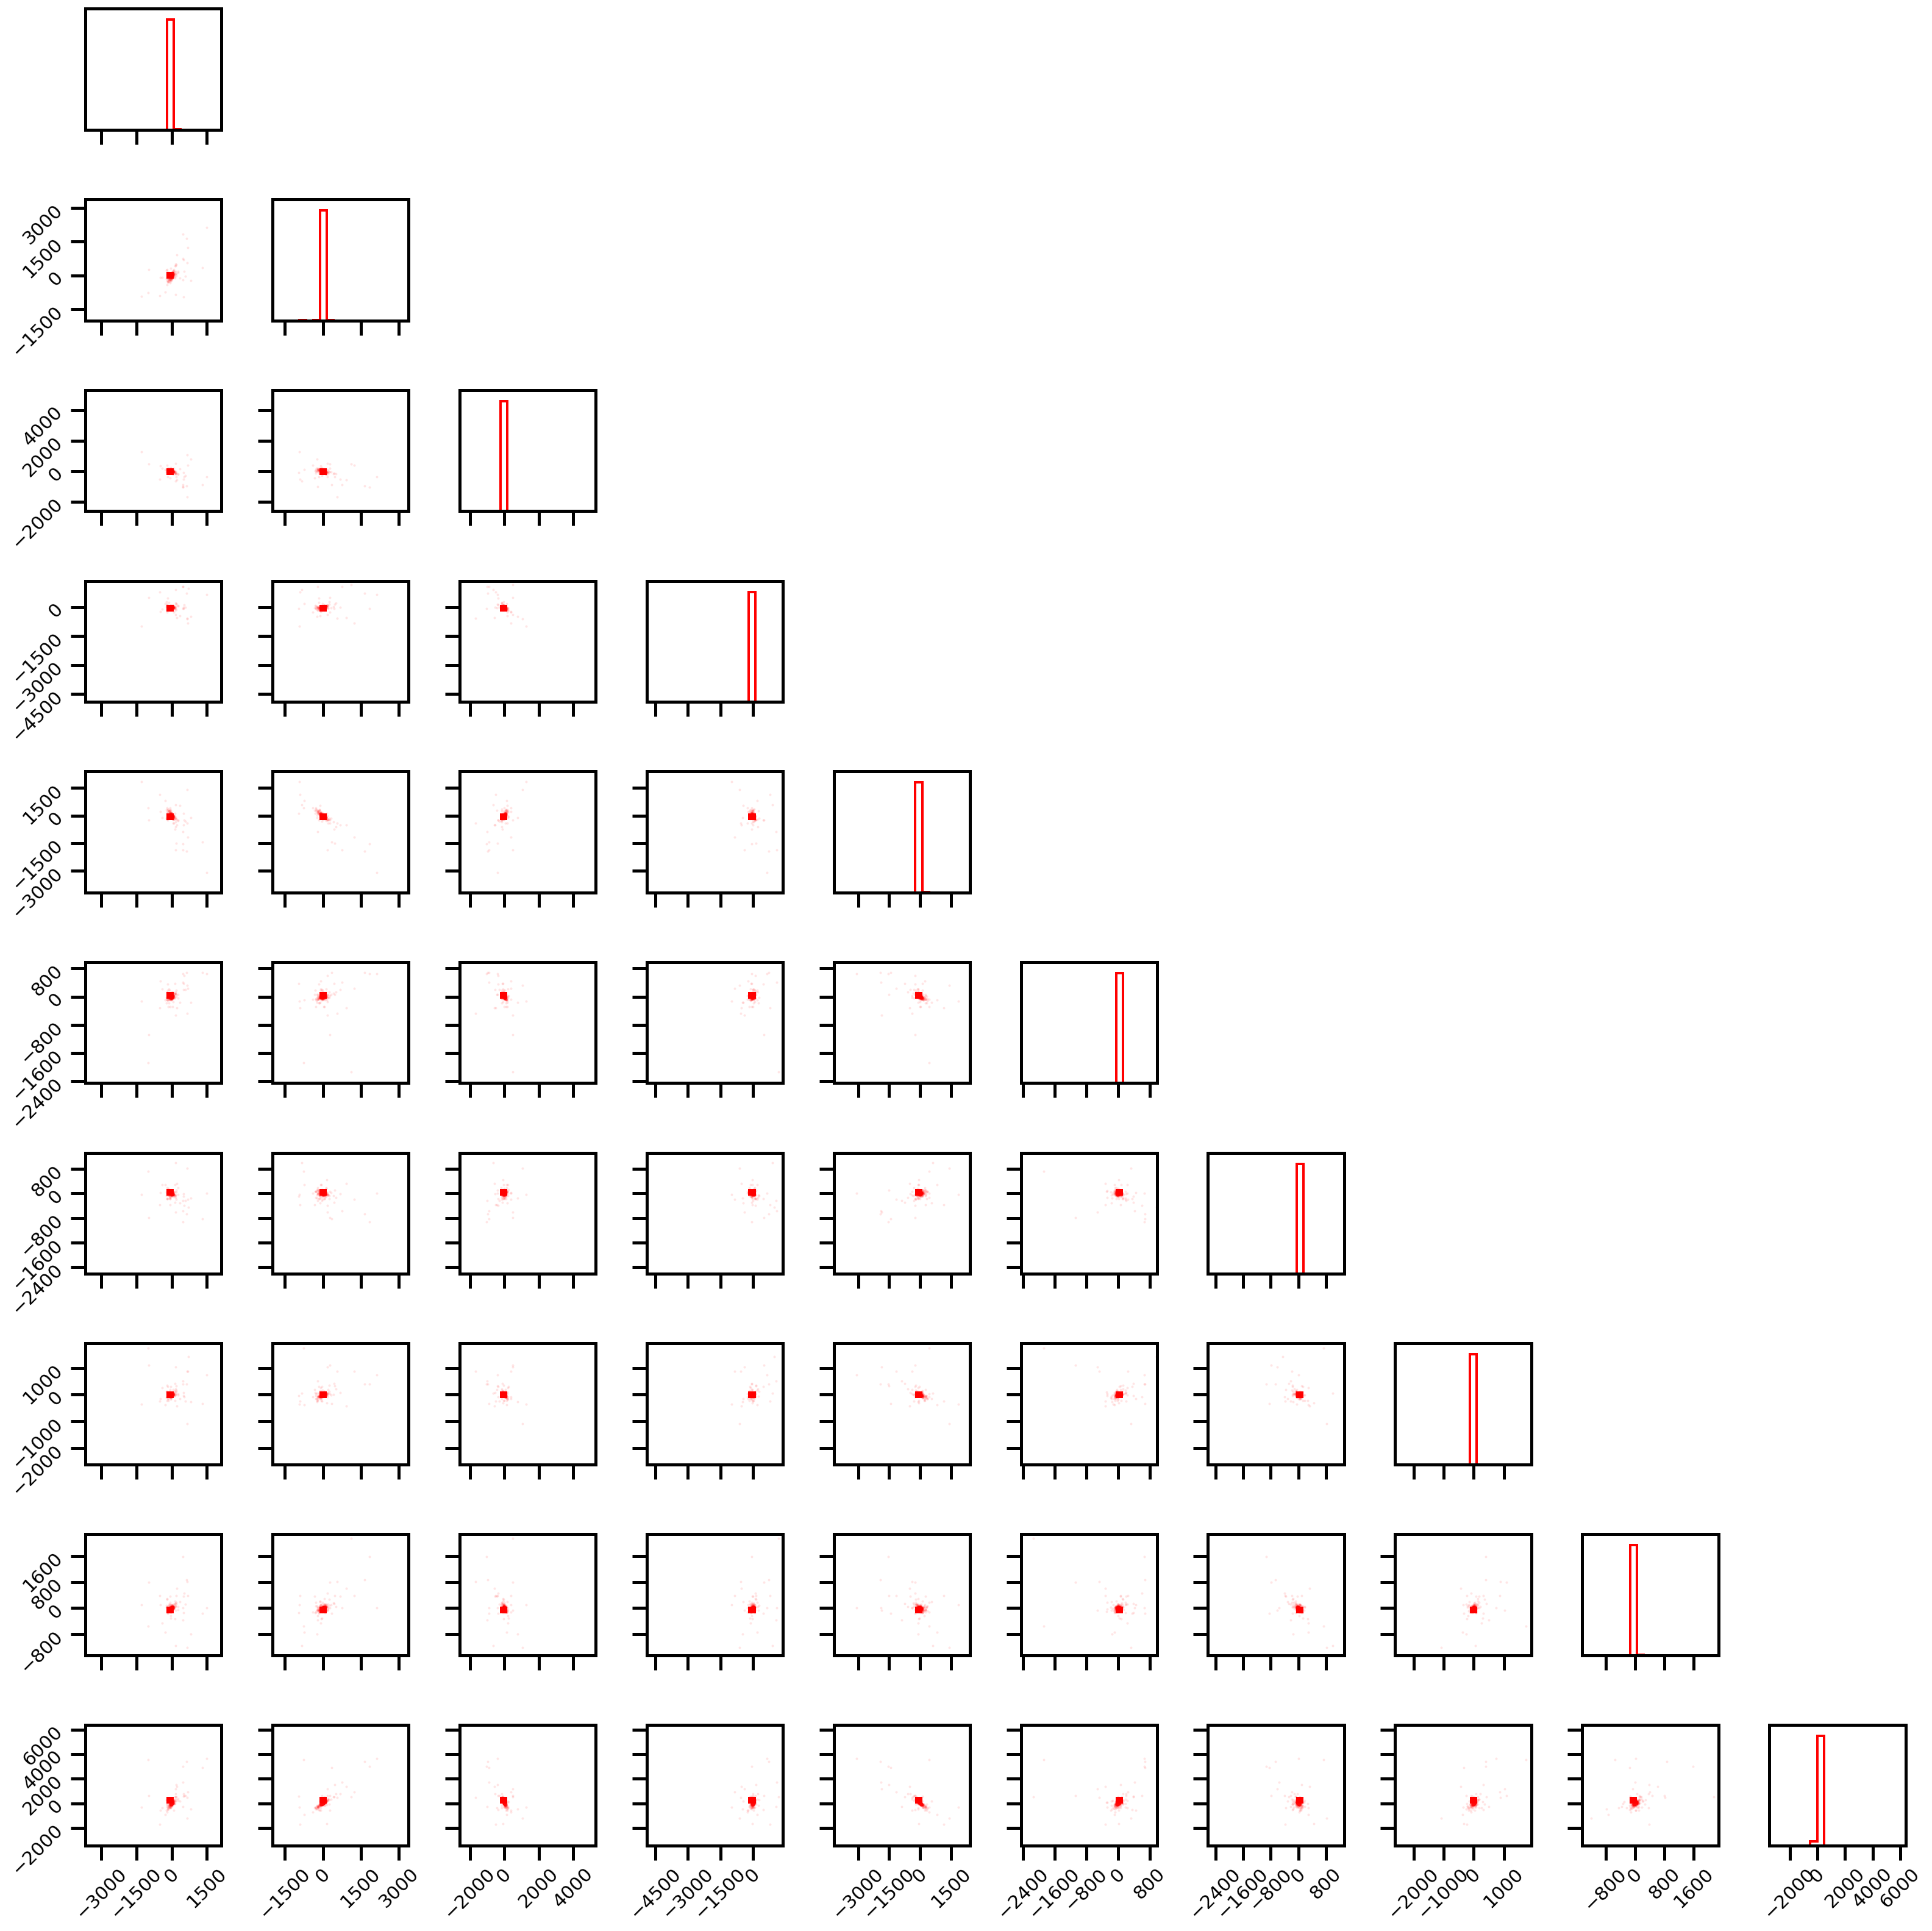
for idataset in datasets:
    res = get_tc_datasets(n_samples=10_000, n_features=10, seed=42, dataset=idataset)
    print(f"{idataset.capitalize()}")
    fig = corner.corner(res.X, hist_factor=2, color="red")
    plt.tight_layout()
    plt.gcf()
    wandb.log({f"data_{idataset}_X": wandb.Image(fig)})
    plt.show()
    plt.close(fig)
Gaussian
Gaussian_rotation
Linear_rotation
WARNING:root:Too few points to create valid contours
WARNING:root:Too few points to create valid contours
WARNING:root:Too few points to create valid contours
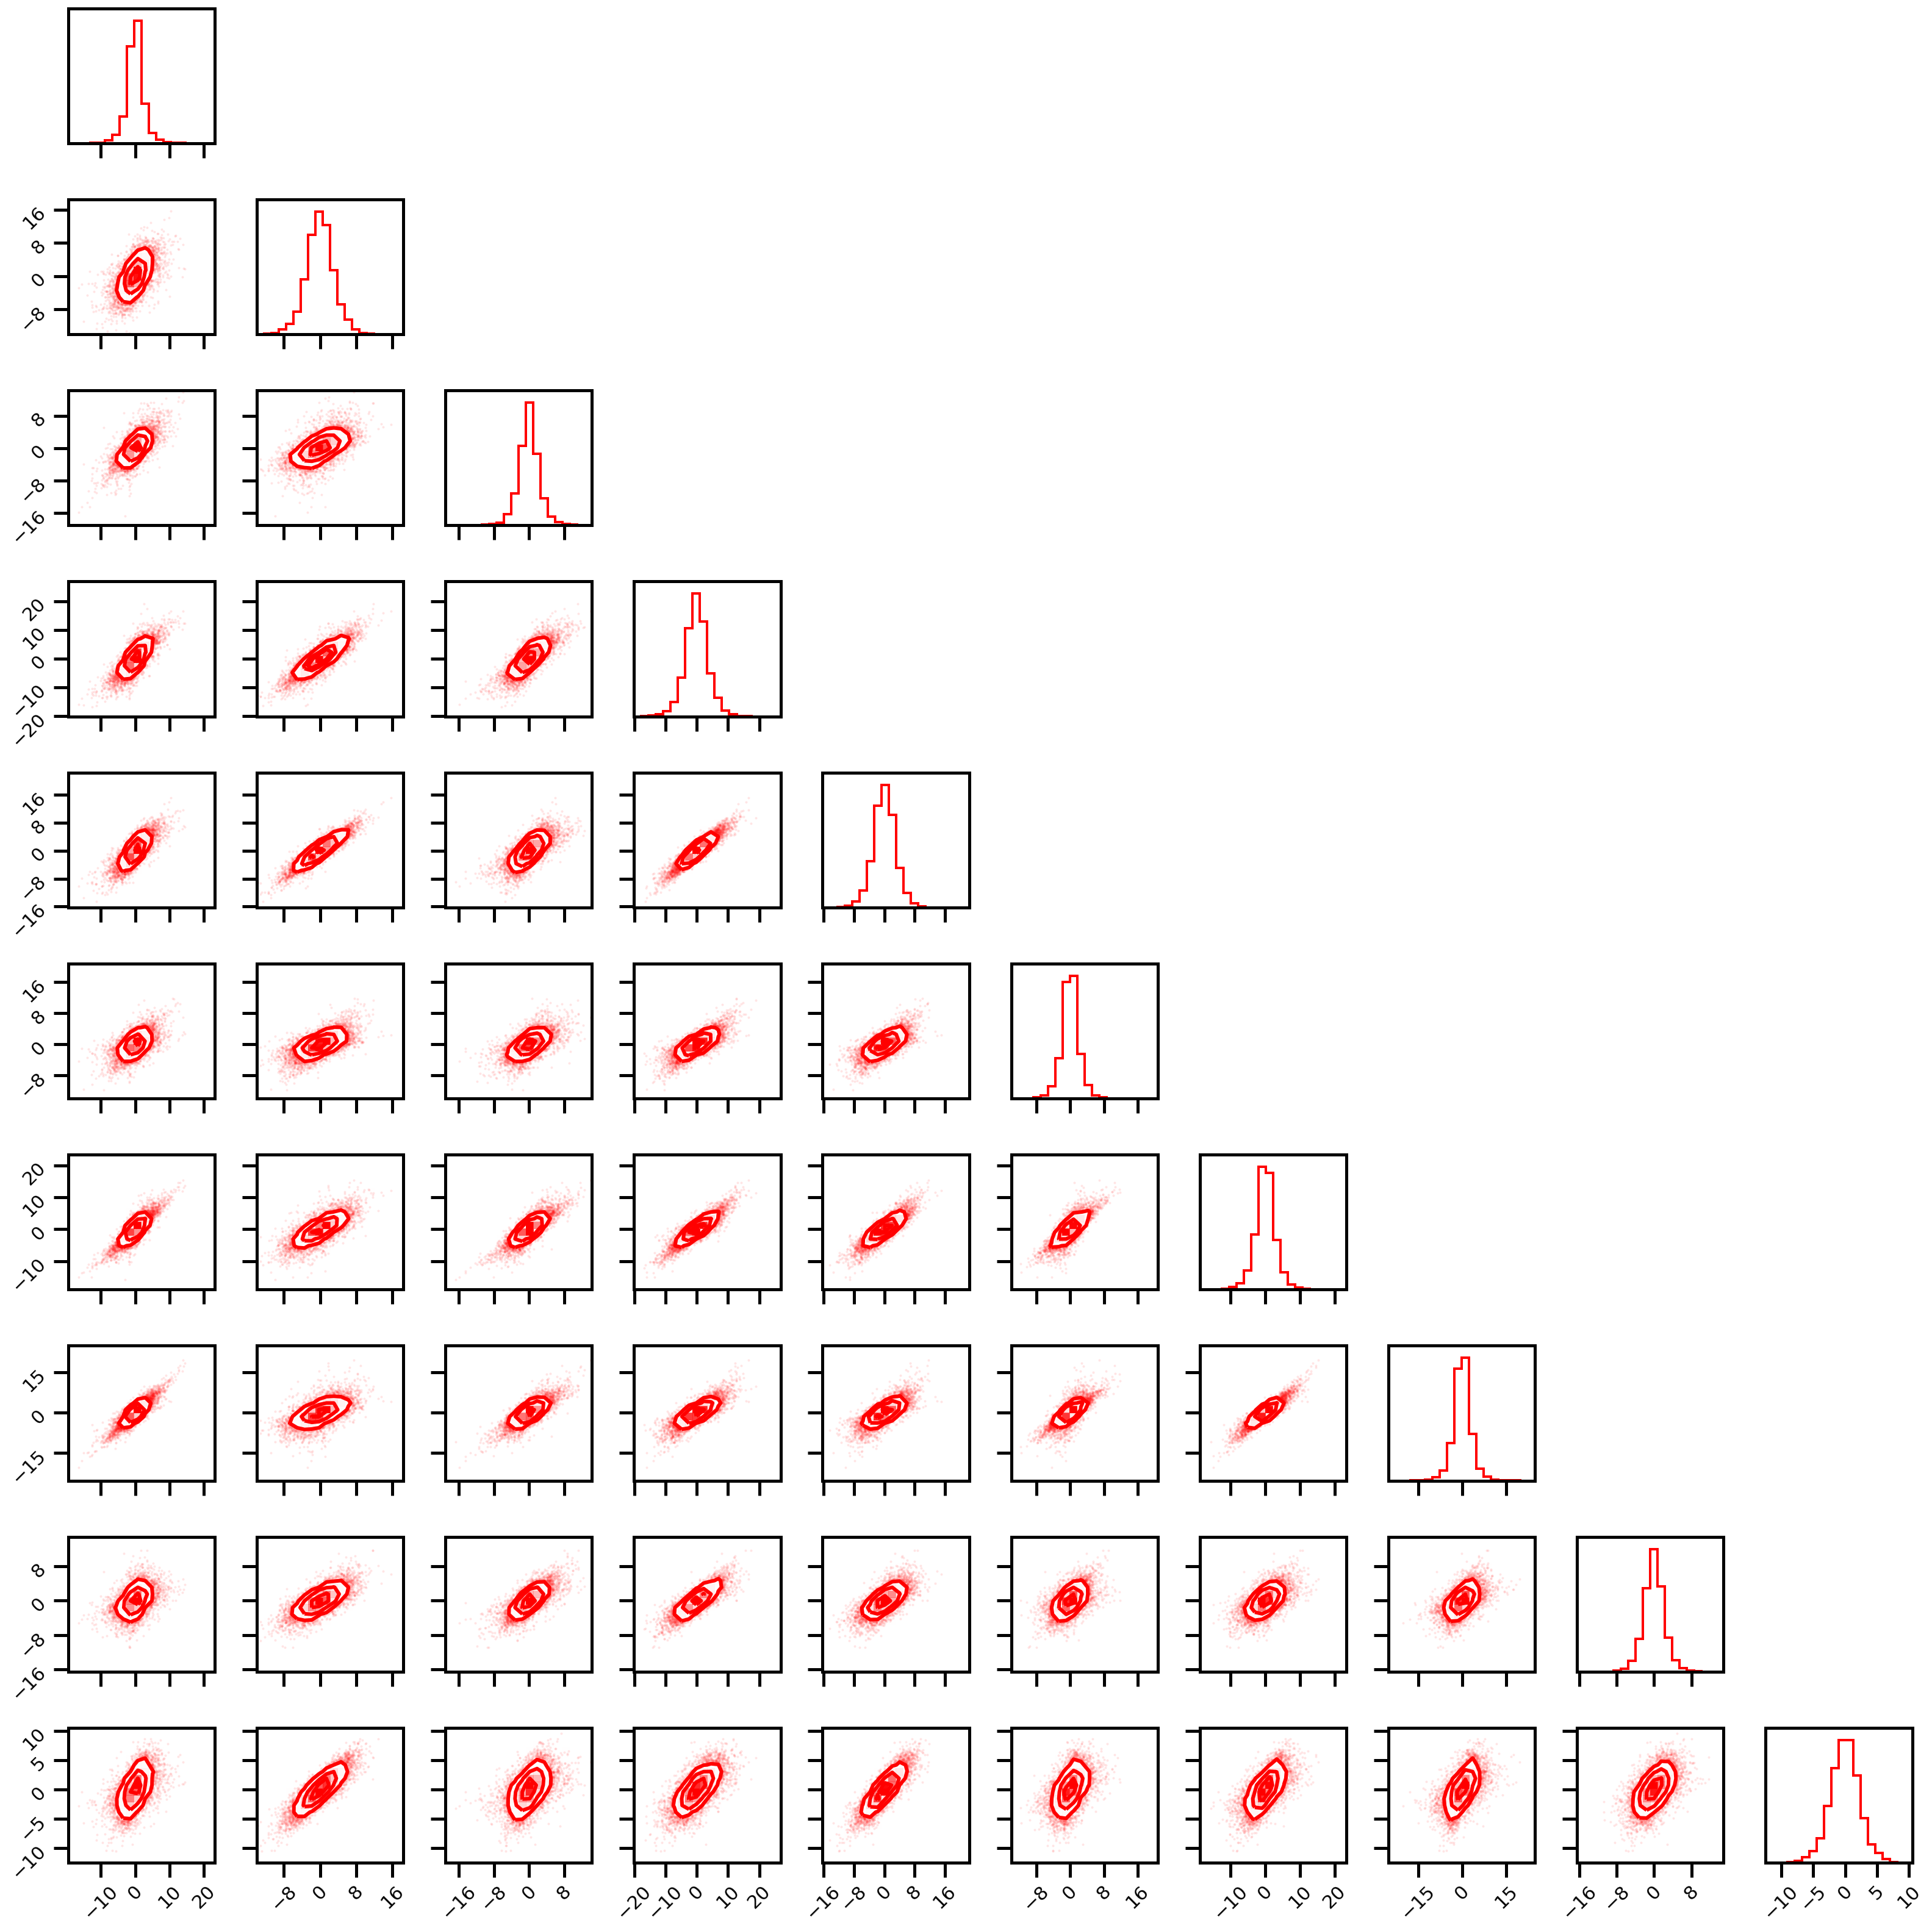
Studentt
WARNING:root:Too few points to create valid contours
WARNING:root:Too few points to create valid contours
WARNING:root:Too few points to create valid contours
WARNING:root:Too few points to create valid contours
WARNING:root:Too few points to create valid contours
WARNING:root:Too few points to create valid contours
WARNING:root:Too few points to create valid contours
WARNING:root:Too few points to create valid contours
WARNING:root:Too few points to create valid contours
WARNING:root:Too few points to create valid contours
WARNING:root:Too few points to create valid contours
WARNING:root:Too few points to create valid contours
WARNING:root:Too few points to create valid contours
WARNING:root:Too few points to create valid contours
WARNING:root:Too few points to create valid contours
WARNING:root:Too few points to create valid contours
WARNING:root:Too few points to create valid contours
WARNING:root:Too few points to create valid contours
WARNING:root:Too few points to create valid contours
WARNING:root:Too few points to create valid contours
WARNING:root:Too few points to create valid contours
WARNING:root:Too few points to create valid contours
WARNING:root:Too few points to create valid contours
WARNING:root:Too few points to create valid contours
WARNING:root:Too few points to create valid contours
WARNING:root:Too few points to create valid contours
WARNING:root:Too few points to create valid contours
WARNING:root:Too few points to create valid contours
WARNING:root:Too few points to create valid contours
WARNING:root:Too few points to create valid contours
WARNING:root:Too few points to create valid contours
WARNING:root:Too few points to create valid contours
WARNING:root:Too few points to create valid contours
WARNING:root:Too few points to create valid contours
WARNING:root:Too few points to create valid contours
WARNING:root:Too few points to create valid contours
WARNING:root:Too few points to create valid contours
WARNING:root:Too few points to create valid contours
WARNING:root:Too few points to create valid contours
WARNING:root:Too few points to create valid contours
WARNING:root:Too few points to create valid contours
WARNING:root:Too few points to create valid contours
WARNING:root:Too few points to create valid contours
WARNING:root:Too few points to create valid contours
WARNING:root:Too few points to create valid contours
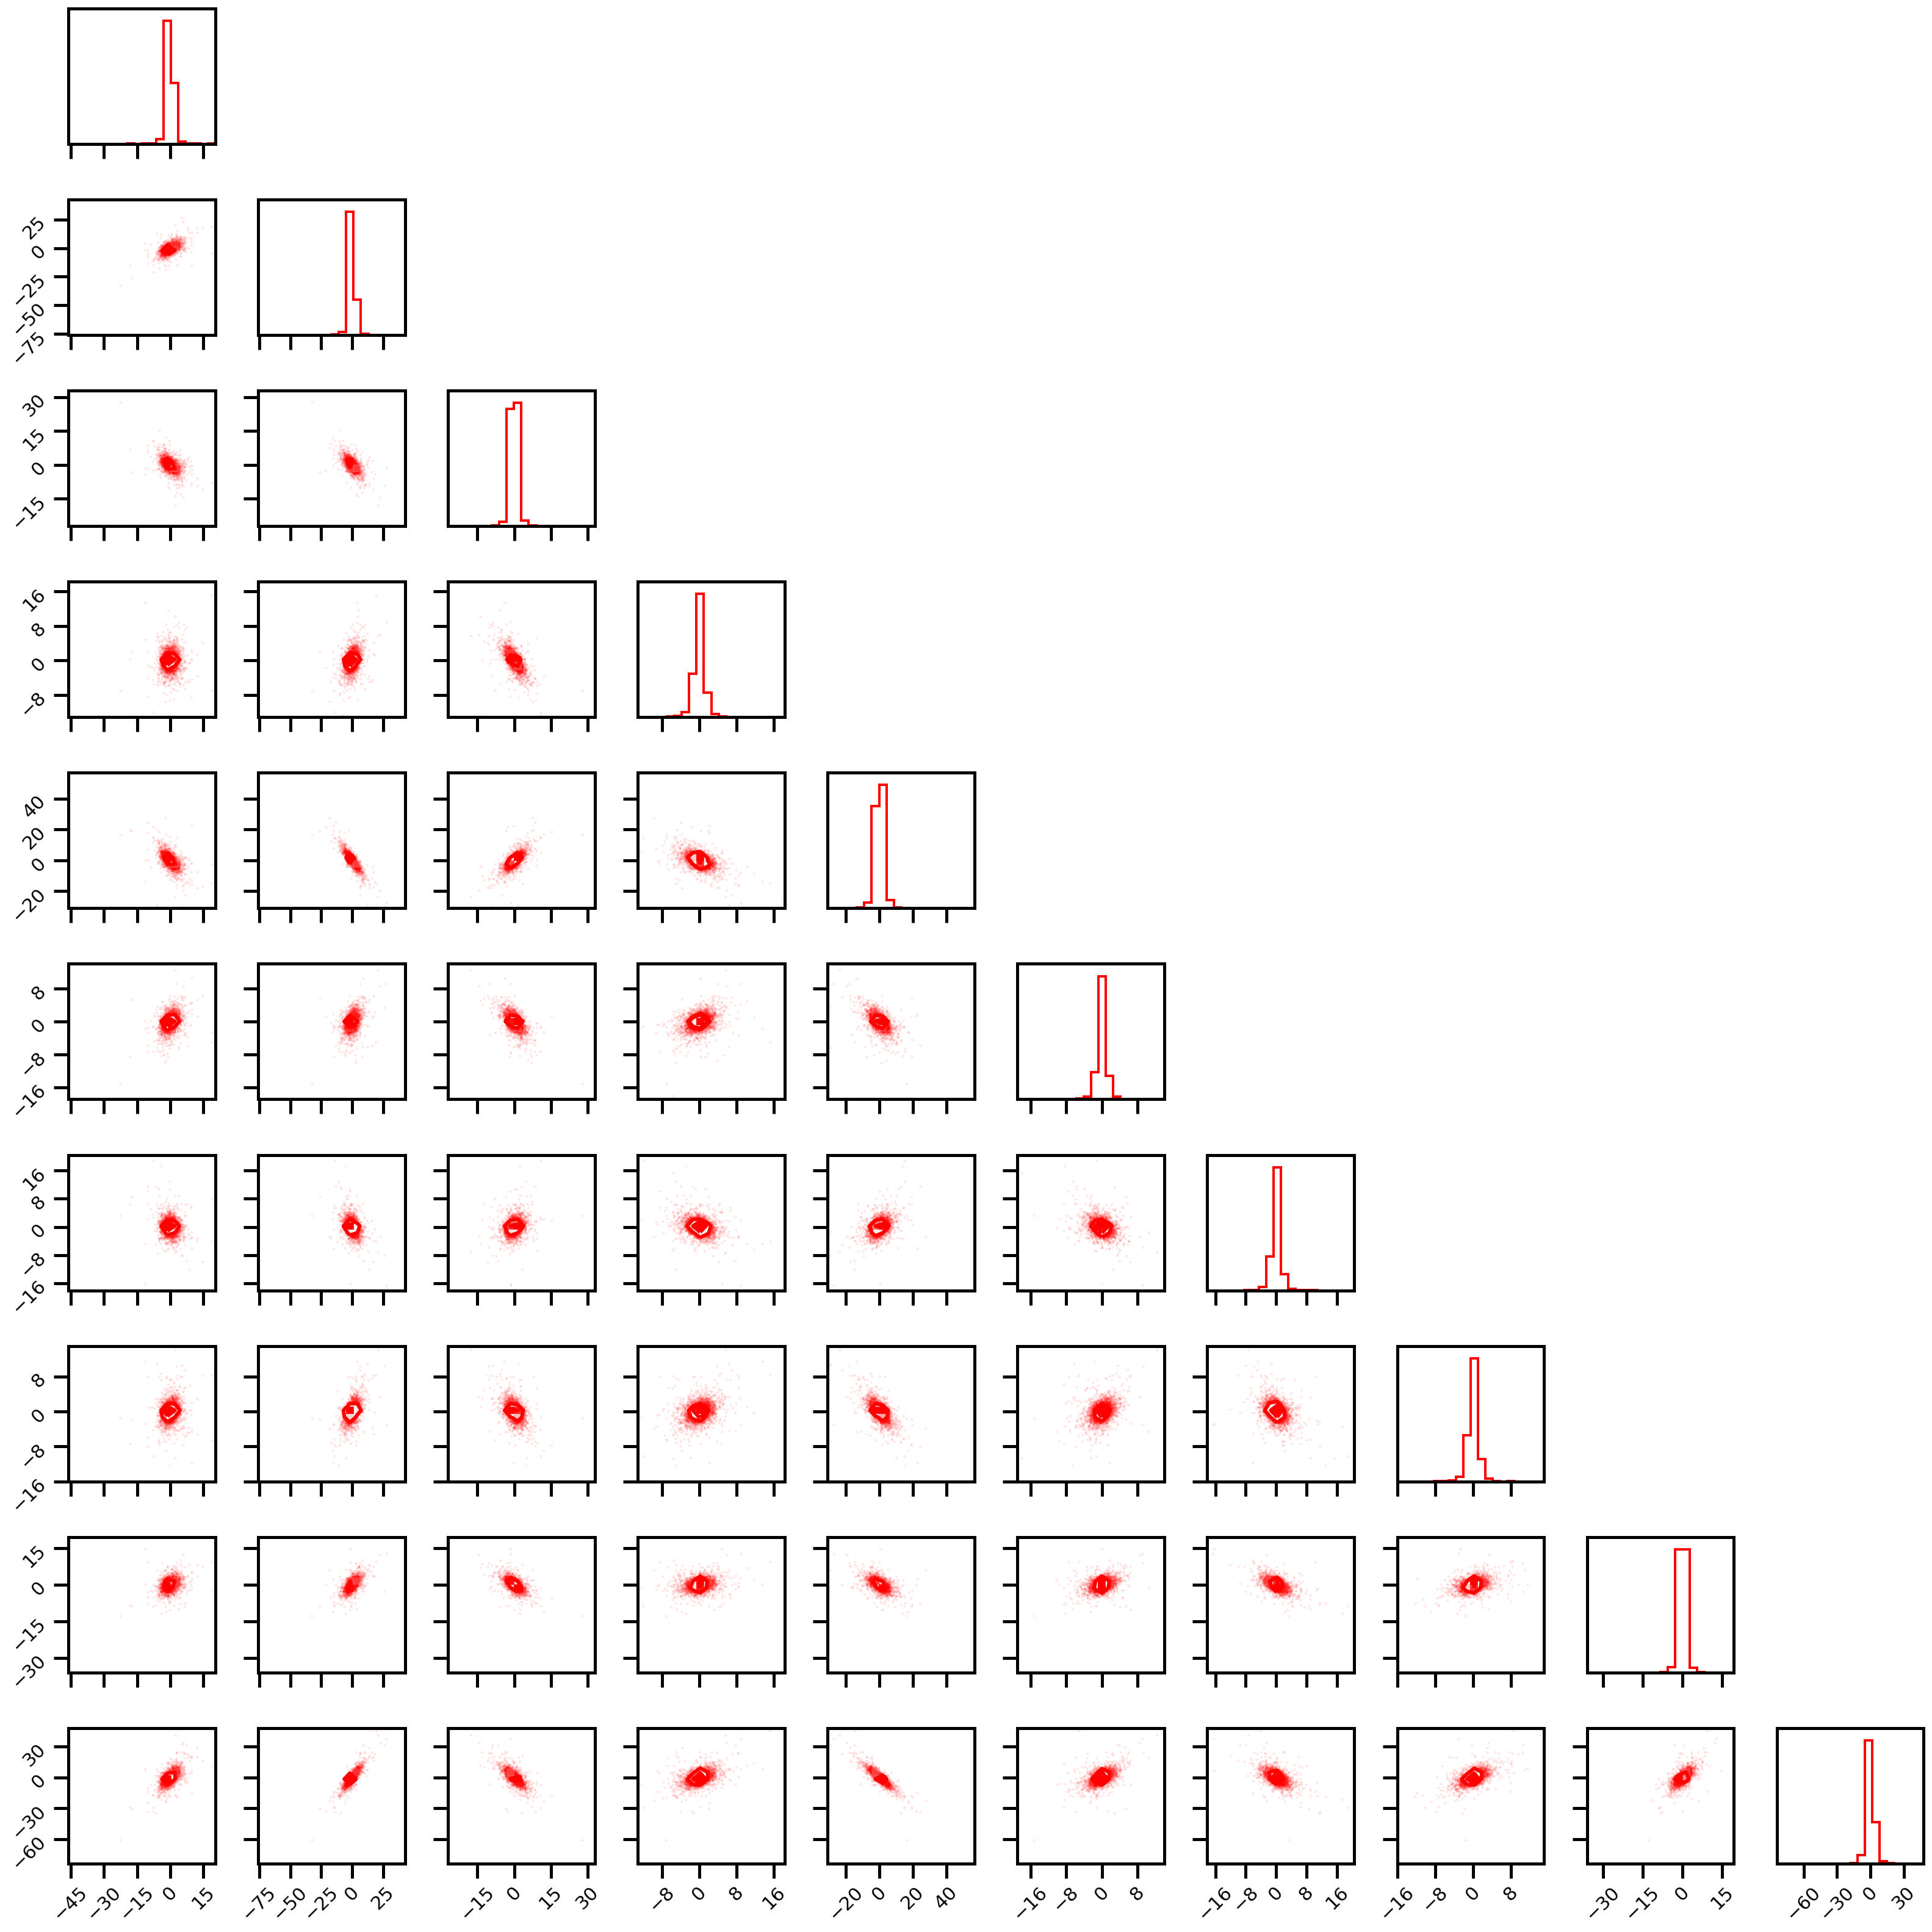
Cauchy
WARNING:root:Too few points to create valid contours
WARNING:root:Too few points to create valid contours
WARNING:root:Too few points to create valid contours
WARNING:root:Too few points to create valid contours
WARNING:root:Too few points to create valid contours
WARNING:root:Too few points to create valid contours
WARNING:root:Too few points to create valid contours
WARNING:root:Too few points to create valid contours
WARNING:root:Too few points to create valid contours
WARNING:root:Too few points to create valid contours
WARNING:root:Too few points to create valid contours
WARNING:root:Too few points to create valid contours
WARNING:root:Too few points to create valid contours
WARNING:root:Too few points to create valid contours
WARNING:root:Too few points to create valid contours
WARNING:root:Too few points to create valid contours
WARNING:root:Too few points to create valid contours
WARNING:root:Too few points to create valid contours
WARNING:root:Too few points to create valid contours
WARNING:root:Too few points to create valid contours
WARNING:root:Too few points to create valid contours
WARNING:root:Too few points to create valid contours
WARNING:root:Too few points to create valid contours
WARNING:root:Too few points to create valid contours
WARNING:root:Too few points to create valid contours
WARNING:root:Too few points to create valid contours
WARNING:root:Too few points to create valid contours
WARNING:root:Too few points to create valid contours
WARNING:root:Too few points to create valid contours
WARNING:root:Too few points to create valid contours
WARNING:root:Too few points to create valid contours
WARNING:root:Too few points to create valid contours
WARNING:root:Too few points to create valid contours
WARNING:root:Too few points to create valid contours
WARNING:root:Too few points to create valid contours
WARNING:root:Too few points to create valid contours
WARNING:root:Too few points to create valid contours
WARNING:root:Too few points to create valid contours
WARNING:root:Too few points to create valid contours
WARNING:root:Too few points to create valid contours
WARNING:root:Too few points to create valid contours
WARNING:root:Too few points to create valid contours
WARNING:root:Too few points to create valid contours
WARNING:root:Too few points to create valid contours
WARNING:root:Too few points to create valid contours
wandb: Network error resolved after 0:00:45.774716, resuming normal operation.
wandb: 500 encountered ({"error":"Error 1040: Too many connections"}), retrying request
wandb: Network error resolved after 0:00:10.234407, resuming normal operation.
wandb: 500 encountered ({"errors":[{"message":"Error 1040: Too many connections","path":["project"]}],"data":{"project":null}}), retrying request
wandb: Network error resolved after 0:04:57.411301, resuming normal operation.
wandb: Network error resolved after 0:44:48.190587, resuming normal operation.
wandb: 500 encountered ({"errors":[{"message":"Error 1040: Too many connections","path":["project"]}],"data":{"project":null}}), retrying request
wandb: Network error resolved after 0:05:14.952061, resuming normal operation.
Estimators#
from pysim.information.gaussian import gauss_total_corr
from mutual_info.mutual_info import entropy as mi_entropy
from npeet.entropy_estimators import entropy as npeet_entropy
from rbig.rbig import RBIG
import time
from scipy import stats


class TCResult(NamedTuple):
    time: float
    TC: float
    name: str


def total_correlation(X, f, **kwargs):

    return np.sum([f(ix[:, None], **kwargs) for ix in X.T]) - f(X, **kwargs)


def get_tc_estimators(X, method="gaussian", **kwargs):

    if method == "gaussian":
        t0 = time.time()
        res = gauss_total_corr(X=X.copy())
        t1 = time.time() - t0
        return TCResult(t1, res, "gaussian")

    elif method == "knn_nbs":
        t0 = time.time()
        res = total_correlation(X, mi_entropy, k=10, transform=None)
        t1 = time.time() - t0
        return TCResult(t1, res, "knn_nbs")

    elif method == "knn_eps":
        t0 = time.time()
        res = total_correlation(X, npeet_entropy, k=10, base=np.e)
        t1 = time.time() - t0
        return TCResult(t1, res, "knn_eps")

    elif method == "rbig":
        from rbig.rbig import RBIG

        t0 = time.time()
        rbig_model = RBIG(pdf_extension=10)
        rbig_model.fit(X.copy())
        res = rbig_model.mutual_information * np.log(2)
        t1 = time.time() - t0
        return TCResult(t1, res, "rbig")
    else:
        raise ValueError(f"Unrecognized estimator.")
Toy Data#
from pysim.utils import dict_product


datasets = [
    "gaussian",
    "gaussian_rotation",
    "linear_rotation",
    "studentt",
    "cauchy",
]
n_samples = [100, 1_000, 10_000, 100_000]

params = {
    "n_features": [2, 3, 5, 10, 15],
    "n_trials": list(np.arange(1, 11)),
    "dataset": datasets,
}
params = dict_product(params)

models = [
    "gaussian",
    "knn_nbs",
    "knn_eps",
    "rbig",
]
Gaussian#
Implementation Notes:
We randomly generate a positive semi-definite \(D \times D\) matrix. This acts as our covariance matrix \(\boldsymbol{\Sigma}\).
We use a mean, \(\boldsymbol{\mu}\) of \(\mathbf{0}\).
We generate an upper limit of 5e5 data points and then random subset the requested number.
from functools import partial
from tqdm.autonotebook import tqdm, trange
import tqdm
import pandas as pd

results_df = pd.DataFrame()
results_dict = {}

with tqdm.tqdm(params) as pbar:

    for i, iparam in enumerate(pbar):

        # generate data
        res_tuple = get_tc_datasets(
            n_samples=200_000,
            n_features=iparam["n_features"],
            seed=iparam["n_trials"],
            dataset=iparam["dataset"],
        )

        #         results_dict = {**results_dict, **iparam}
        #         results_dict["model"] = "true"
        #         results_dict["dataset"] = iparam["dataset"]
        #         results_dict["tc"] = res_tuple.TC

        #         results_dict["time"] = 0.0

        #         results_df = pd.concat(
        #             [results_df, pd.DataFrame(results_dict, index=[i])], axis=0
        #         )

        rng = np.random.RandomState(iparam["n_trials"])

        for isamples in n_samples:

            # Subsample data
            sub_idx = rng.choice(np.arange(res_tuple.X.shape[0]), isamples)

            X_sub = res_tuple.X[sub_idx]

            for imodel in models:

                pbar.set_description(
                    f"Features: {iparam['n_features']} | Trial: {iparam['n_trials']} | Samples: {isamples} | Models: {imodel}"
                )

                # KNN (NEIGHBOURS)

                # do calculation
                res = get_tc_estimators(X=X_sub.copy(), method=imodel)

                results_dict = {**results_dict, **iparam}
                results_dict["model"] = res.name
                results_dict["dataset"] = iparam["dataset"]
                results_dict["approx"] = res.TC
                results_dict["true"] = res_tuple.TC
                results_dict["time"] = res.time
                results_dict["n_samples"] = isamples
                results_dict["n_features"] = iparam["n_features"]

                results_df = pd.concat(
                    [results_df, pd.DataFrame(results_dict, index=[i])], axis=0
                )
Features: 15 | Trial: 5 | Samples: 100000 | Models: rbig: 90%|████████▉ | 224/250 [4:46:23<1:44:46, 241.80s/it]
results_df.tail()
results_df.to_csv("./rbig_consistency.csv")
wandb.log({"results": wandb.Table(dataframe=results_df)})
import json

with open("./temp_res.json") as json_data:
    data = json.load(json_data)

results_df = pd.DataFrame(data["data"], columns=data["columns"])
results_df.head()
| n_samples | n_features | n_trials | dataset | model | mi | time | approx | true | |
|---|---|---|---|---|---|---|---|---|---|
| 0 | 1000 | 1 | 1 | gaussian | true | 0.452329 | 0.000000 | 0.000000 | 0.000000 |
| 1 | 1000 | 1 | 1 | gaussian | gaussian | 0.452329 | 0.002186 | 0.451450 | 0.452329 |
| 2 | 1000 | 1 | 1 | gaussian | rv | 0.452329 | 0.000250 | 0.593796 | 0.452329 |
| 3 | 1000 | 1 | 1 | gaussian | knn_nbs | 0.452329 | 0.024578 | 0.414026 | 0.452329 |
| 4 | 1000 | 1 | 1 | gaussian | knn_eps | 0.452329 | 0.011041 | 0.428369 | 0.452329 |
results_df_approx = results_df.copy()
def create_results_xr(df):

    df = df[df["n_samples"] != 100]

    # make index the experiment params
    df = df.set_index(["model", "n_samples", "n_features", "n_trials", "dataset"])

    #
    df_xr = df.to_xarray()

    return df_xr


def get_mu_std(ds):

    # mean
    mu = ds.mean(dim="n_trials")

    # standard deviation
    std = ds.std(dim="n_trials")

    return mu, std
results_xr = create_results_xr(results_df_approx)
results_xr
<xarray.Dataset>
Dimensions:     (dataset: 5, model: 4, n_features: 5, n_samples: 3, n_trials: 10)
Coordinates:
  * model       (model) object 'gaussian' 'knn_eps' 'knn_nbs' 'rbig'
  * n_samples   (n_samples) int64 1000 10000 100000
  * n_features  (n_features) int64 2 3 5 10 15
  * n_trials    (n_trials) int64 1 2 3 4 5 6 7 8 9 10
  * dataset     (dataset) object 'cauchy' 'gaussian' ... 'studentt'
Data variables:
    approx      (model, n_samples, n_features, n_trials, dataset) float64 0.7...
    true        (model, n_samples, n_features, n_trials, dataset) float64 0.6...
    time        (model, n_samples, n_features, n_trials, dataset) float64 0.0...
xarray.Dataset
- dataset: 5
- model: 4
- n_features: 5
- n_samples: 3
- n_trials: 10
- model(model)object'gaussian' 'knn_eps' ... 'rbig'
array(['gaussian', 'knn_eps', 'knn_nbs', 'rbig'], dtype=object)
- n_samples(n_samples)int641000 10000 100000
array([ 1000, 10000, 100000])
- n_features(n_features)int642 3 5 10 15
array([ 2, 3, 5, 10, 15])
- n_trials(n_trials)int641 2 3 4 5 6 7 8 9 10
array([ 1, 2, 3, 4, 5, 6, 7, 8, 9, 10])
- dataset(dataset)object'cauchy' 'gaussian' ... 'studentt'
array(['cauchy', 'gaussian', 'gaussian_rotation', 'linear_rotation',
       'studentt'], dtype=object)
- approx(model, n_samples, n_features, n_trials, dataset)float640.7249 0.4517 2.856 ... 21.12 9.276
array([[[[[ 7.24899088e-01, 4.51677383e-01, 2.85624726e+00, 6.68309070e-01, 4.15924522e-01], [ 3.35387280e+00, 1.07111603e-01, 1.23105158e+00, 3.48058260e+00, 1.16366877e-01], [ 3.74183518e-03, 1.27977388e-02, 2.70372369e-01, 3.55621923e-01, 5.05562564e-02], ..., [ 6.98279421e-02, 6.01113416e-04, 1.61853477e+00, 1.21032158e+00, 1.30097731e-03], [ 9.66633607e-02, 1.37460426e-02, 1.62418305e+00, 1.20072563e+00, 1.13582394e-01], [ 4.19587082e-01, 5.63123171e-02, 3.89645621e-01, 1.23858629e+00, 2.07332130e-02]], [[ 2.03001574e+00, 5.00278625e-01, 3.75084714e+00, 1.73468548e+00, 5.23787910e-01], [ 8.73916441e+00, 5.52536153e-01, 3.89482620e+00, 1.67739044e+00, 5.74211682e-01], [ 9.39557713e-01, 1.18542338e-01, 3.68213680e+00, 3.30580277e+00, 1.51305536e-01], ... [ 5.52625524e+00, 2.78862074e+00, 1.18212830e+01, 1.20753162e+01, 4.65541402e+00], [ 6.30554680e+00, 4.69319265e+00, 1.68081882e+01, 1.51411407e+01, 6.75146741e+00], [ 8.03370592e+00, 4.66332003e+00, 1.40271129e+01, 1.32412339e+01, 6.67610744e+00]], [[ 9.18906980e+00, 4.65755999e+00, 2.37730435e+01, 1.96955510e+01, 7.71310078e+00], [ 1.05804387e+01, 5.37374407e+00, 2.30028239e+01, 2.58274541e+01, 8.48065055e+00], [ 9.73331262e+00, 5.97911455e+00, 2.52522582e+01, 2.17569053e+01, 9.32374213e+00], ..., [ 1.09626293e+01, 5.48559917e+00, 1.97822987e+01, 1.84340746e+01, 8.89918575e+00], [ 1.15358668e+01, 8.08235080e+00, 2.41027072e+01, 2.35102109e+01, 1.16467167e+01], [ 1.13398775e+01, 6.05745347e+00, 1.78931271e+01, 2.11175354e+01, 9.27595689e+00]]]]]) - true(model, n_samples, n_features, n_trials, dataset)float640.6765 0.4523 2.854 ... 5.663 7.616
array([[[[[ 6.76500789e-01, 4.52329361e-01, 2.85362480e+00, -1.16887373e+00, 4.94740772e-01], [ 3.38315145e-01, 1.14143717e-01, 1.21593905e+00, -3.03639209e+00, 1.56555128e-01], [ 2.44367079e-01, 2.01956513e-02, 2.96407911e-01, -1.22709655e+00, 6.26070620e-02], ..., [ 2.24195865e-01, 2.44377242e-05, 1.63752112e+00, -4.58718796e+00, 4.24358484e-02], [ 2.44330335e-01, 2.01589079e-02, 1.67511198e+00, -1.28753518e+00, 6.25703185e-02], [ 2.69182667e-01, 4.50112397e-02, 4.02371654e-01, -2.02407961e+00, 8.74226504e-02]], [[ 1.05530904e+00, 5.24284794e-01, 3.68340207e+00, -1.81460464e+00, 6.34750583e-01], [ 1.09715975e+00, 5.66135499e-01, 3.82489900e+00, 2.21973456e-01, 6.76601288e-01], [ 6.63737505e-01, 1.32713258e-01, 3.73470161e+00, -3.36946561e+00, 2.43179047e-01], ... [ 6.10916491e+00, 2.79744030e+00, 1.18459572e+01, 5.34362336e+00, 3.68211063e+00], [ 8.00632040e+00, 4.69459579e+00, 1.68549341e+01, 5.11496789e+00, 5.57926612e+00], [ 7.97205213e+00, 4.66032753e+00, 1.40122869e+01, 3.72993589e+00, 5.54499786e+00]], [[ 1.01511668e+01, 4.65169282e+00, 2.38240969e+01, 1.30233532e+01, 6.21681170e+00], [ 1.08615879e+01, 5.36211400e+00, 2.30792395e+01, 5.59526118e+00, 6.92723287e+00], [ 1.14444223e+01, 5.94494833e+00, 2.52317636e+01, 1.22592668e+01, 7.51006721e+00], ..., [ 1.09698442e+01, 5.47037027e+00, 1.98003383e+01, 1.48386952e+01, 7.03548914e+00], [ 1.35773236e+01, 8.07784964e+00, 2.42340841e+01, 1.15906686e+01, 9.64296851e+00], [ 1.15506185e+01, 6.05114451e+00, 1.79095220e+01, 5.66329707e+00, 7.61626339e+00]]]]]) - time(model, n_samples, n_features, n_trials, dataset)float640.0003858 0.0002987 ... 174.8 151.0
array([[[[[3.85761261e-04, 2.98738480e-04, 4.83751297e-04,
           2.79664993e-04, 3.85284424e-04],
          [3.87668610e-04, 3.19242477e-04, 4.04834747e-04,
           3.85761261e-04, 3.19480896e-04],
          [4.20808792e-04, 3.65495682e-04, 5.76496124e-04,
           3.50952148e-04, 4.96625900e-04],
          ...,
          [3.08036804e-04, 4.20331955e-04, 2.30550766e-04,
           5.82218170e-04, 5.64813614e-04],
          [3.21865082e-04, 4.88996506e-04, 4.01258469e-04,
           2.63690948e-04, 4.05788422e-04],
          [3.02314758e-04, 6.04867935e-04, 6.26802444e-04,
           5.69343567e-04, 4.74452972e-04]],

         [[4.18424606e-04, 3.08036804e-04, 7.25746155e-04,
           3.70025635e-04, 6.99281693e-04],
          [3.02791595e-04, 3.80516052e-04, 3.56674194e-04,
           6.65426254e-04, 4.09841537e-04],
          [3.68118286e-04, 5.87940216e-04, 3.22580338e-04,
           5.86748123e-04, 4.71591949e-04],
...
          [1.13567178e+02, 2.24671469e+01, 2.25134397e+01,
           1.11110818e+02, 7.51226077e+01],
          [1.00901074e+02, 2.24954615e+01, 3.26279621e+01,
           1.31389581e+02, 8.08146241e+01],
          [1.32741254e+02, 2.24396715e+01, 2.24393828e+01,
           1.20874158e+02, 8.20684953e+01]],

         [[1.86585150e+02, 3.15442176e+01, 3.15391555e+01,
           1.47456877e+02, 1.31809060e+02],
          [2.18540401e+02, 3.15169222e+01, 3.15211852e+01,
           2.18600185e+02, 1.35880232e+02],
          [1.84381483e+02, 3.15839179e+01, 3.15136182e+01,
           1.65538806e+02, 1.33646176e+02],
          ...,
          [2.14916822e+02, 3.15038781e+01, 3.19918909e+01,
           1.73697204e+02, 1.50995406e+02],
          [2.22075009e+02, 3.15091352e+01, 3.51040347e+01,
           1.98253085e+02, 1.52025952e+02],
          [1.81856437e+02, 3.15227804e+01, 3.15470724e+01,
           1.74791616e+02, 1.51023215e+02]]]]])
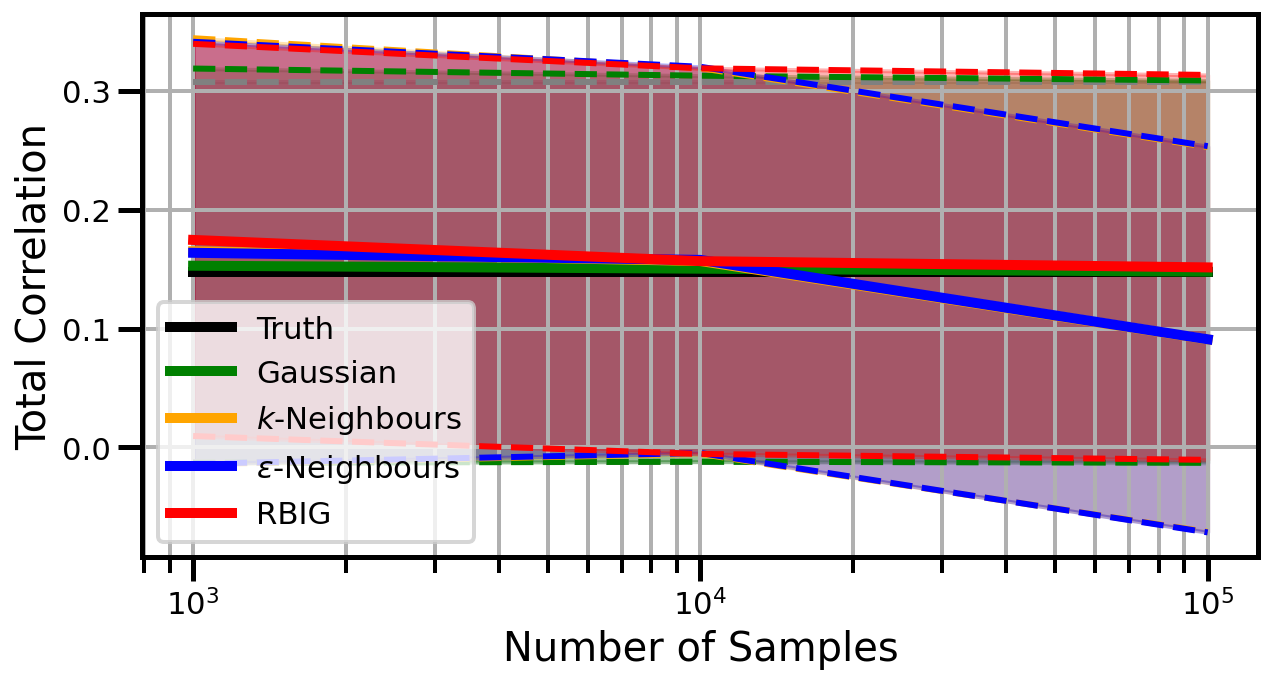
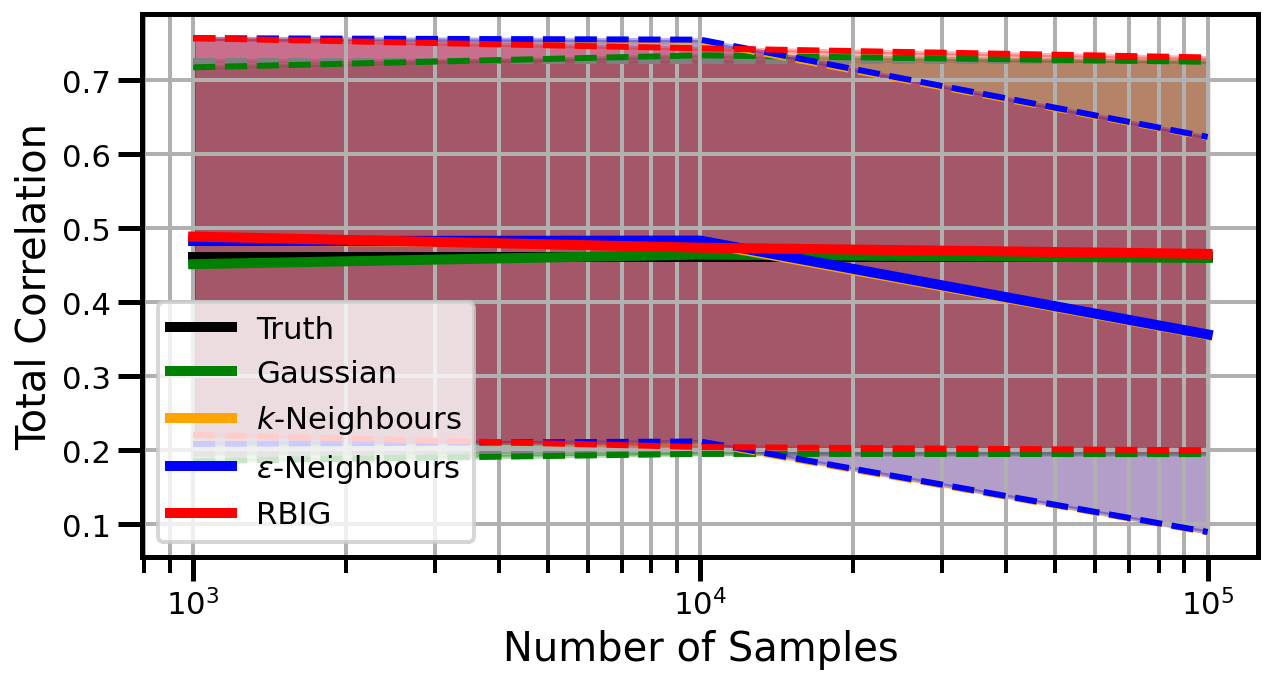
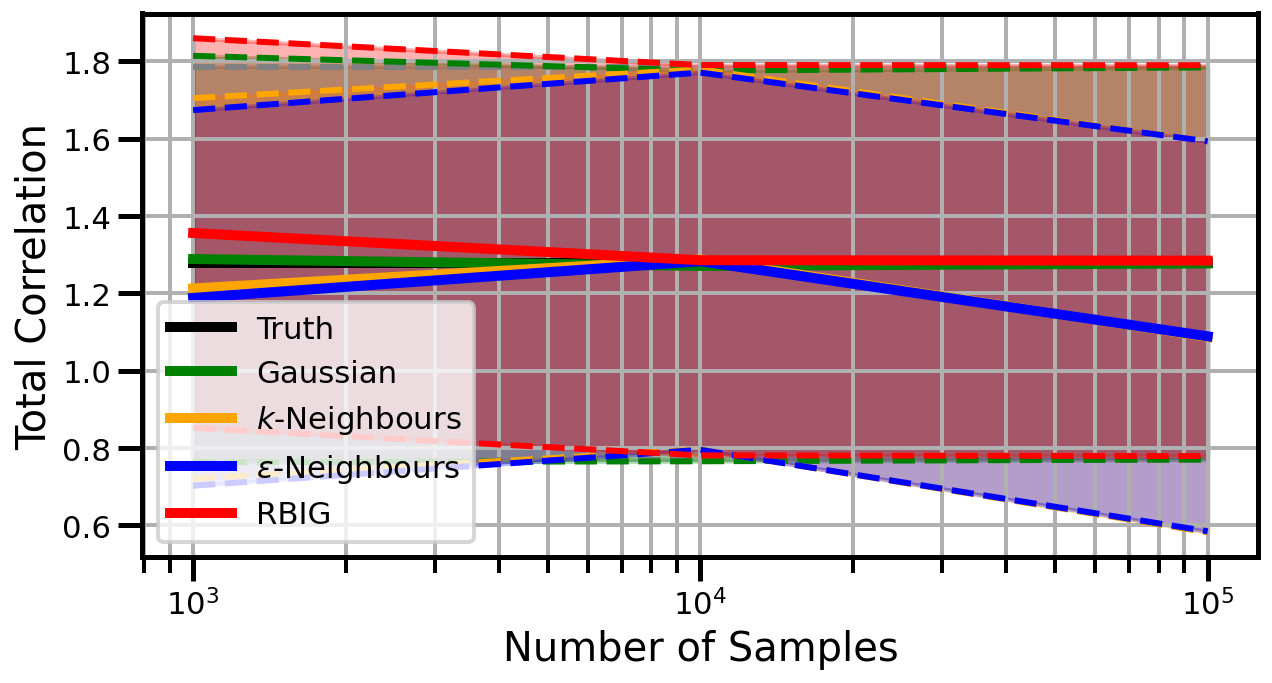
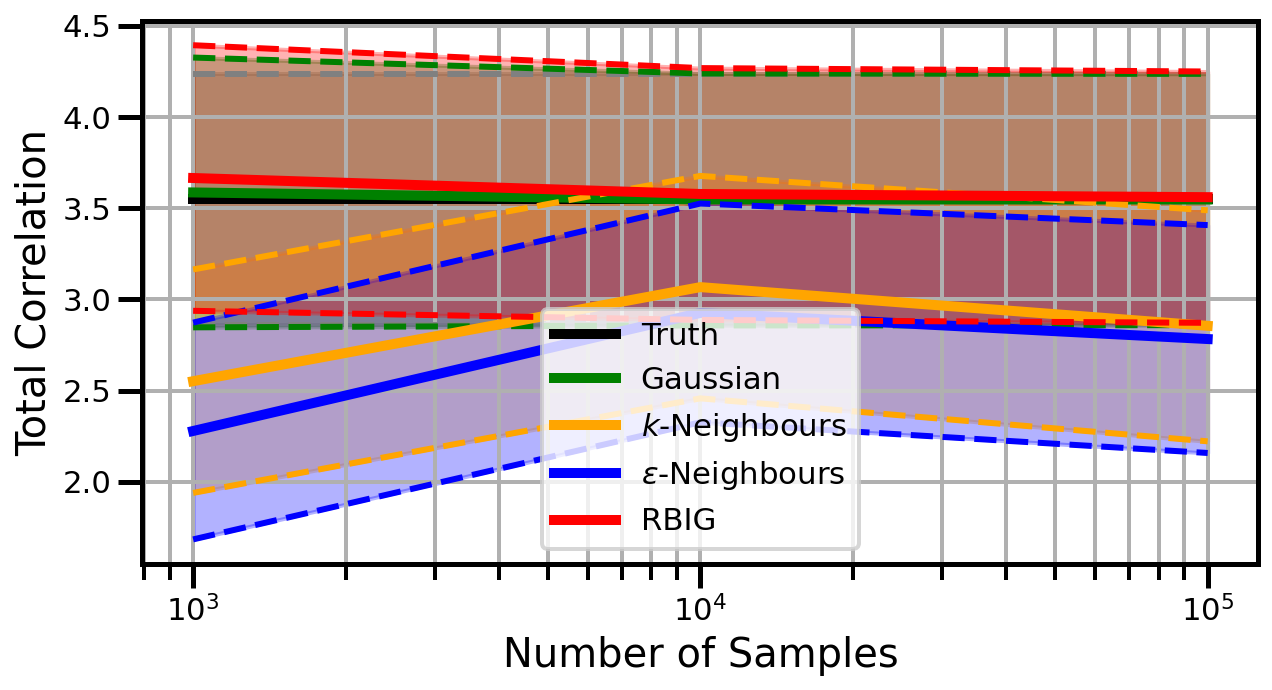
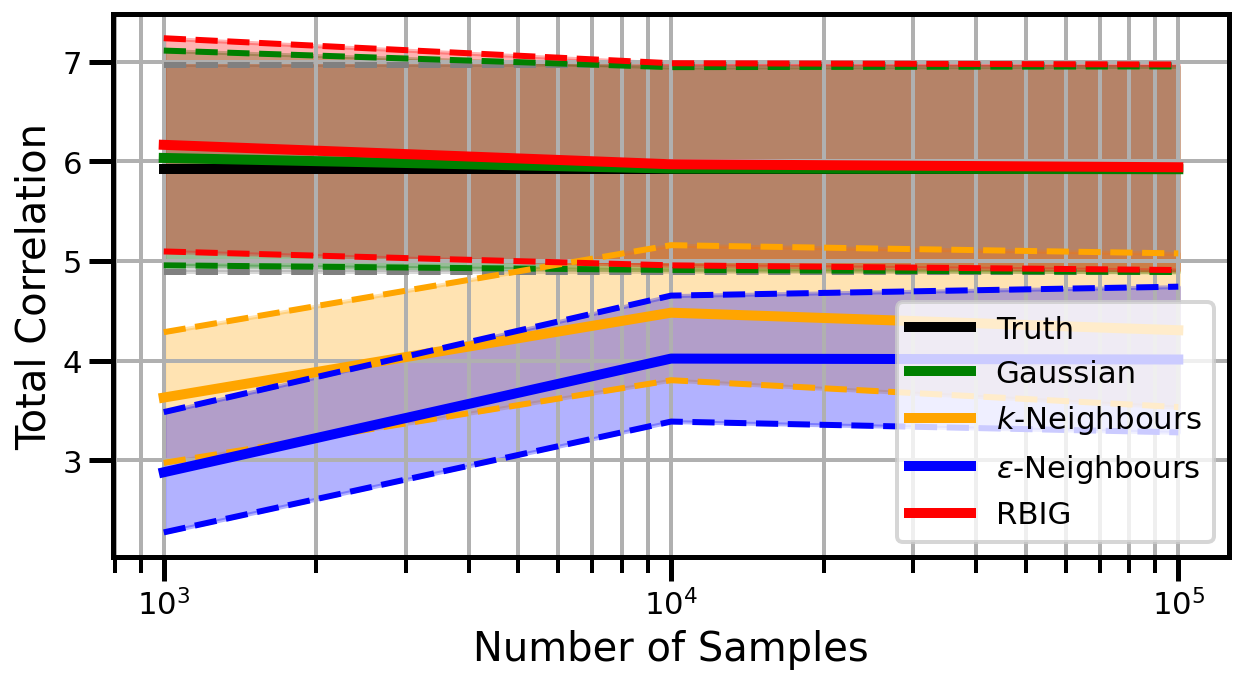
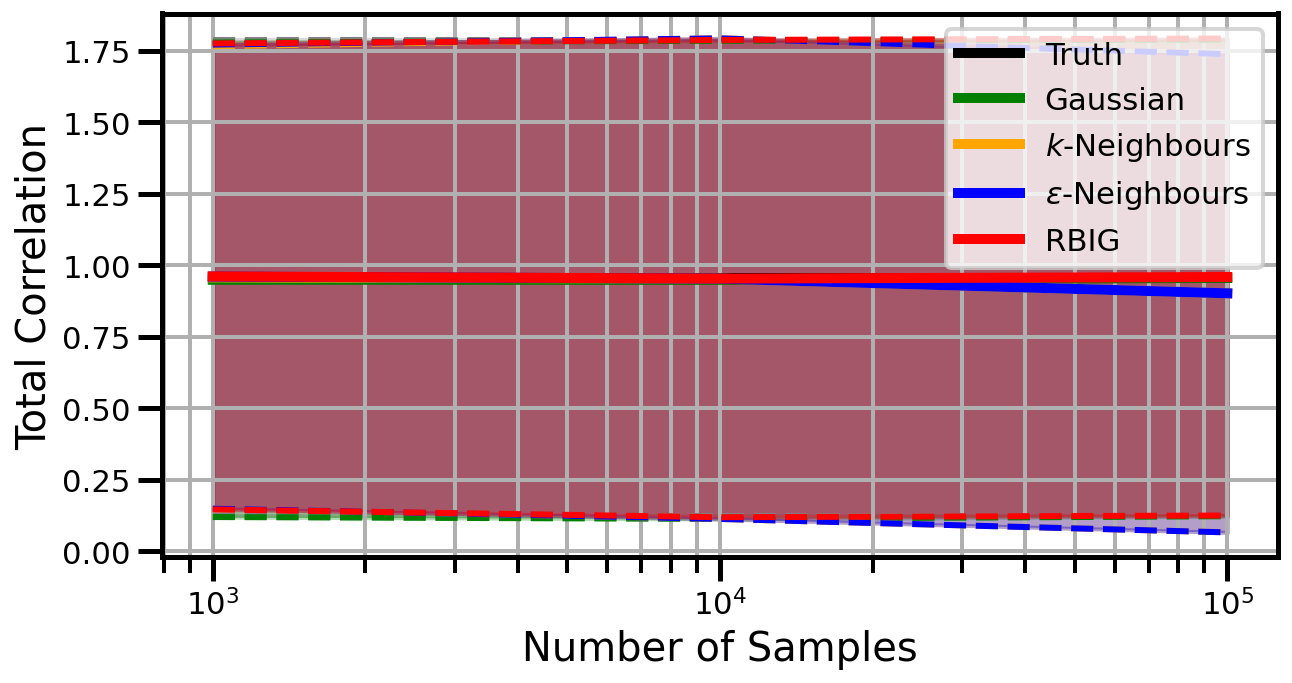
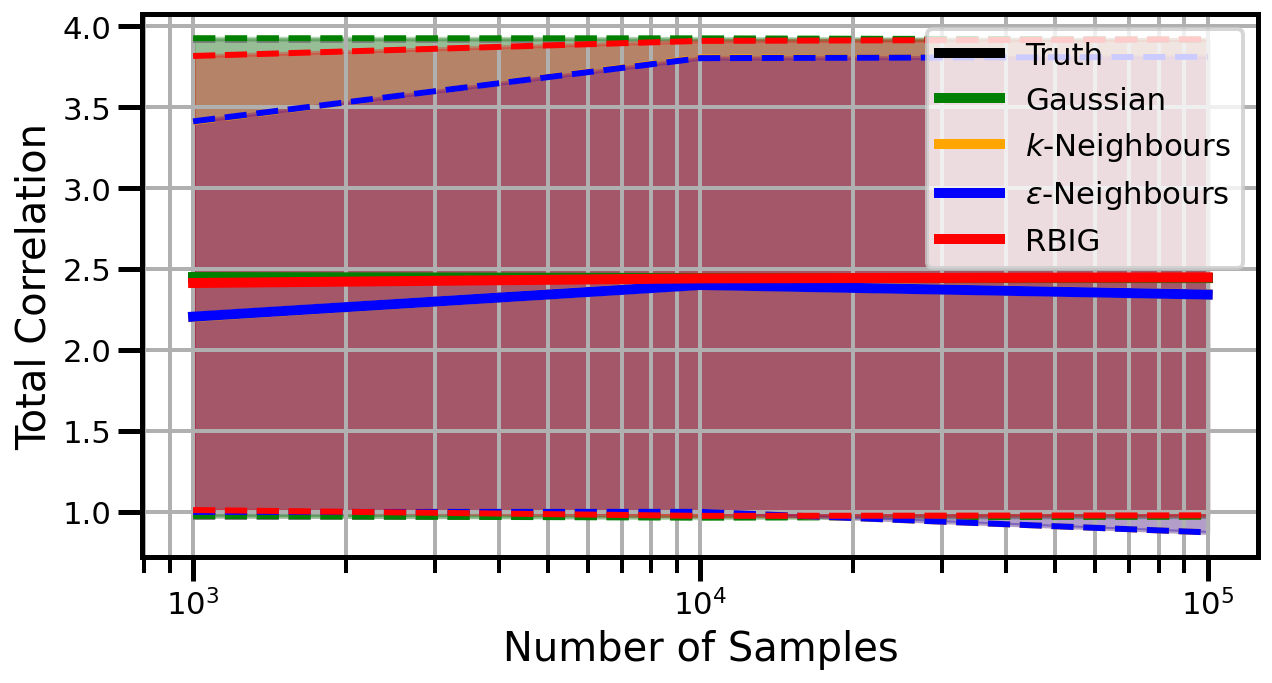
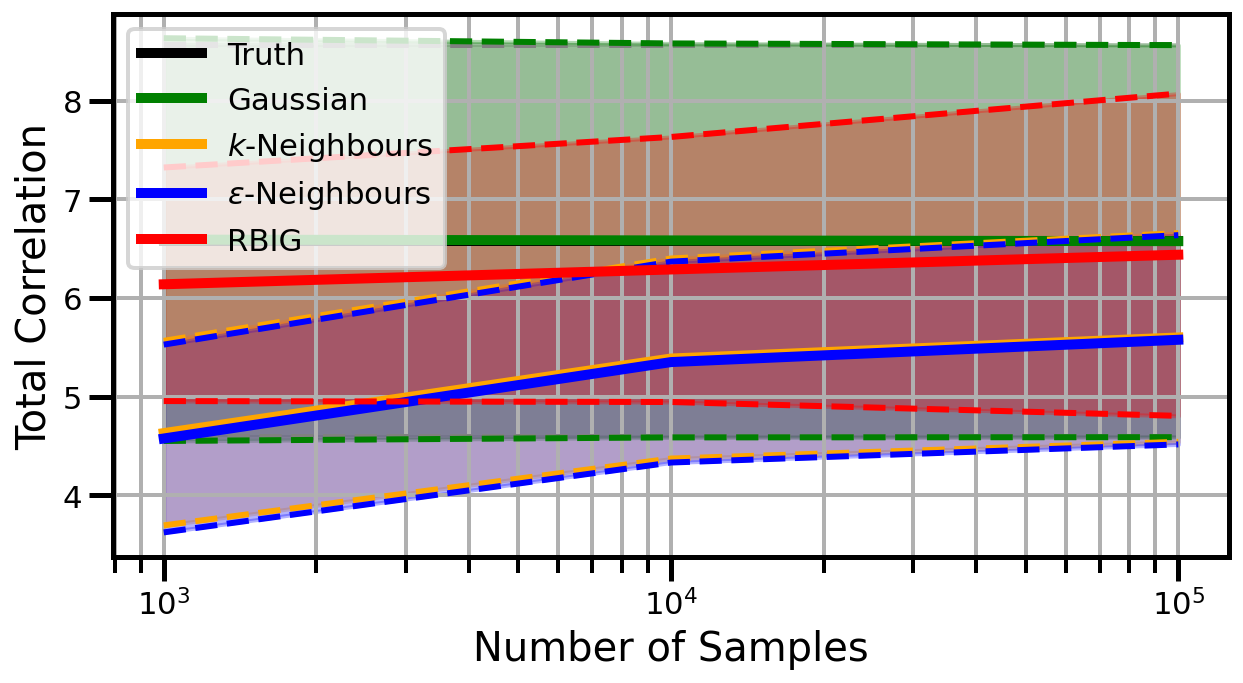
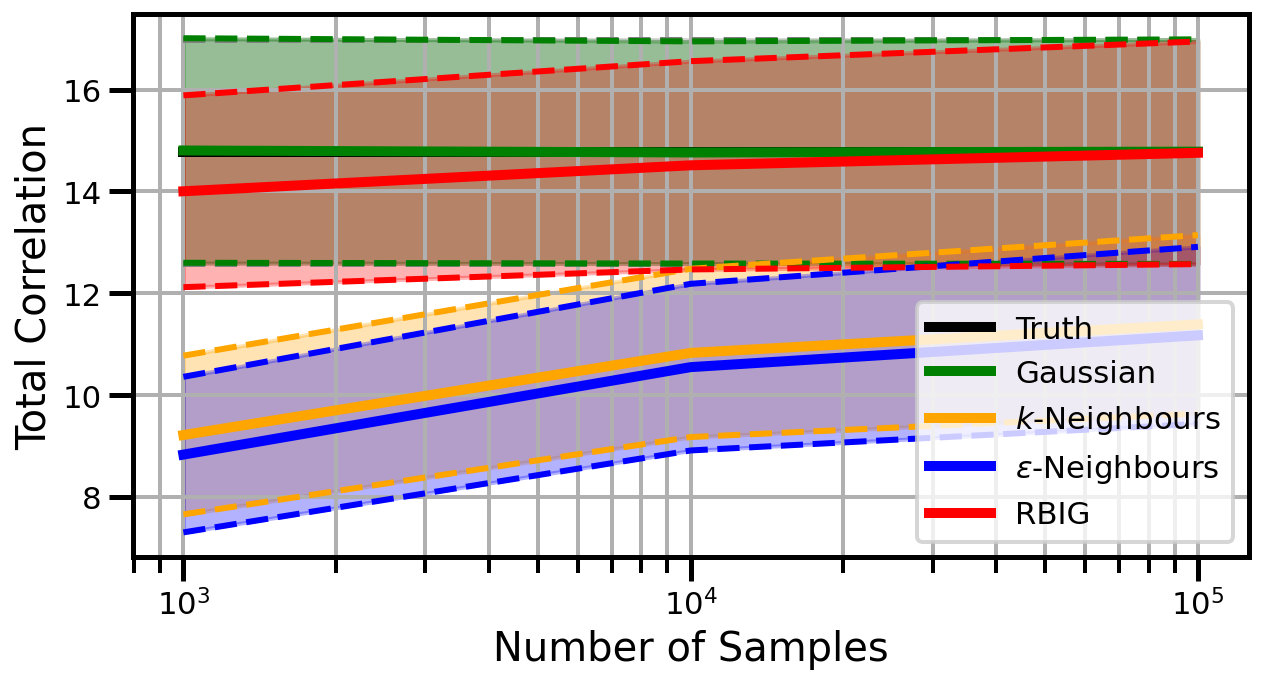
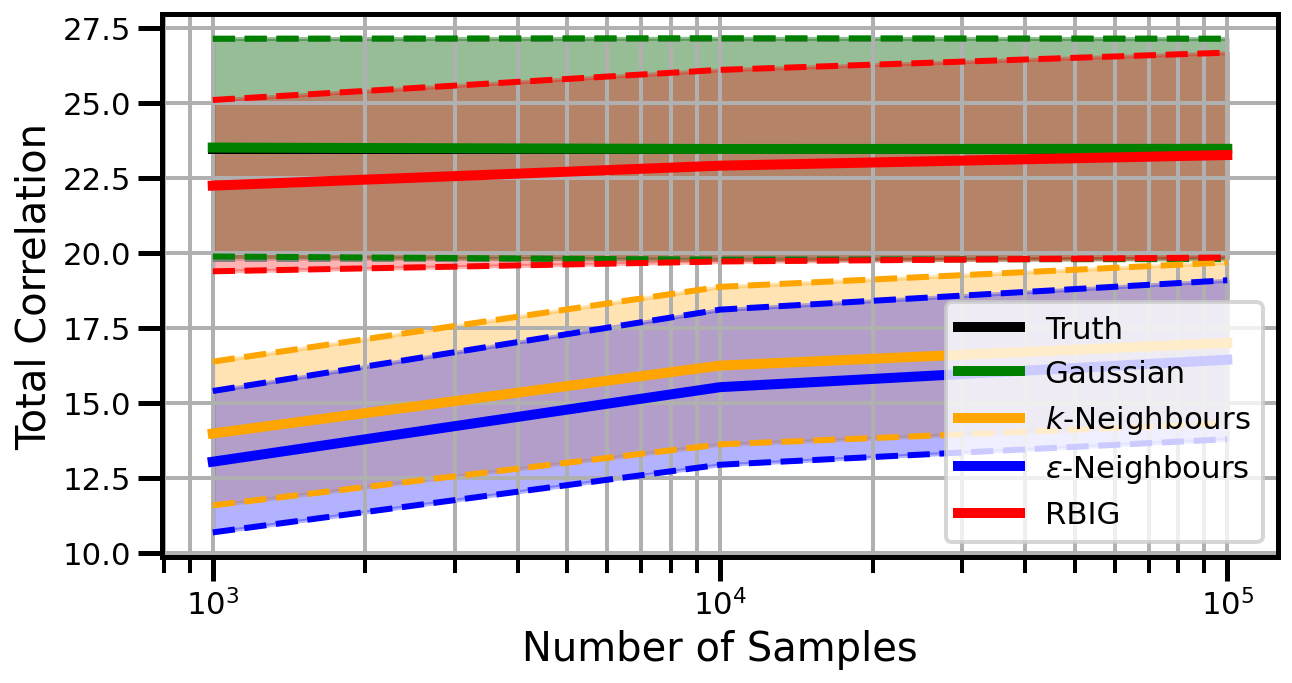
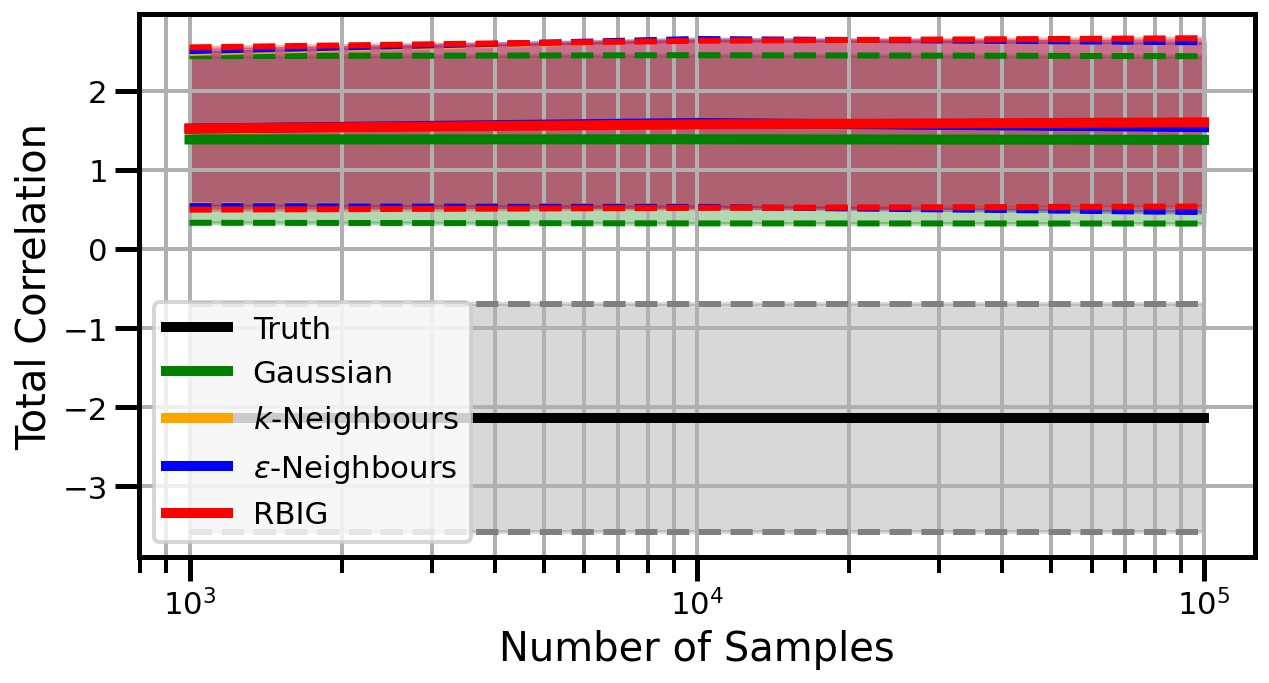
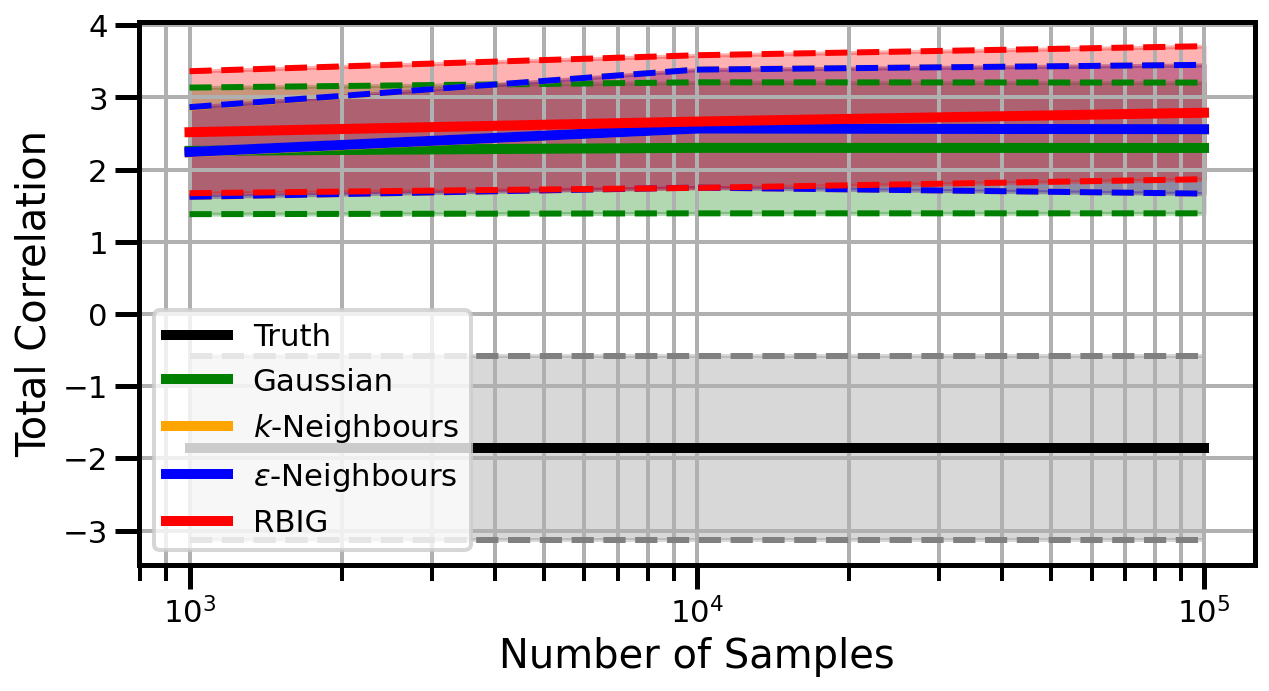
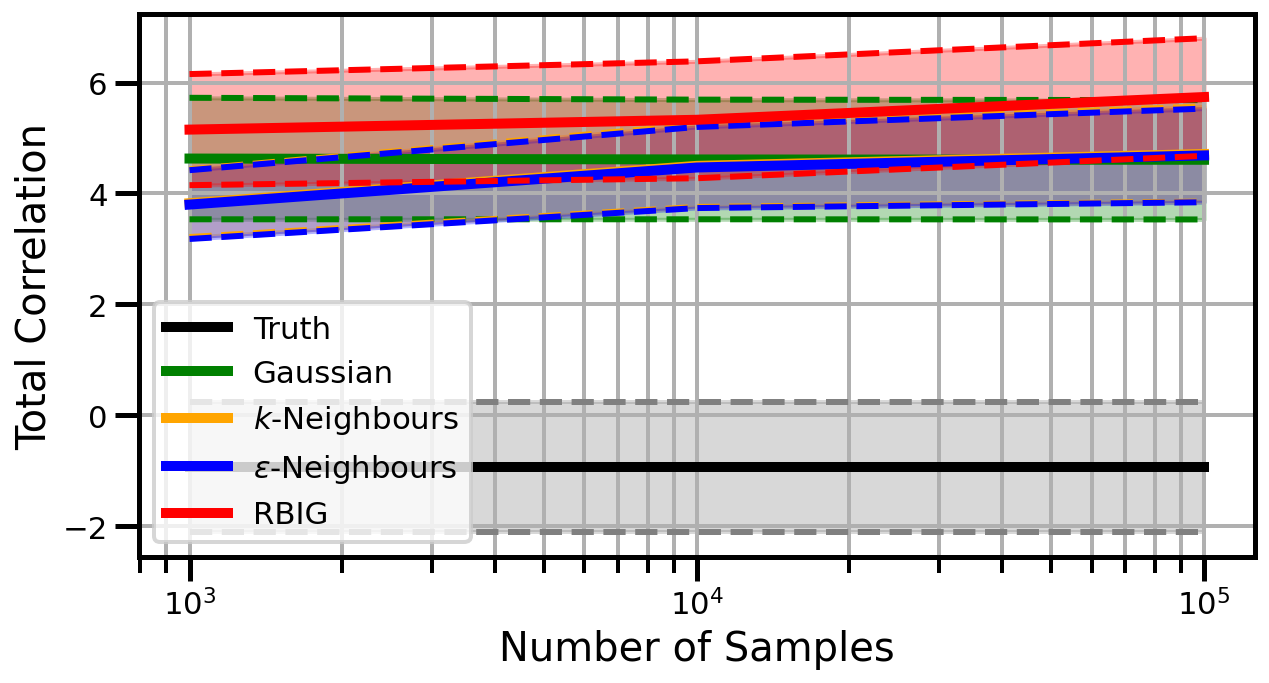
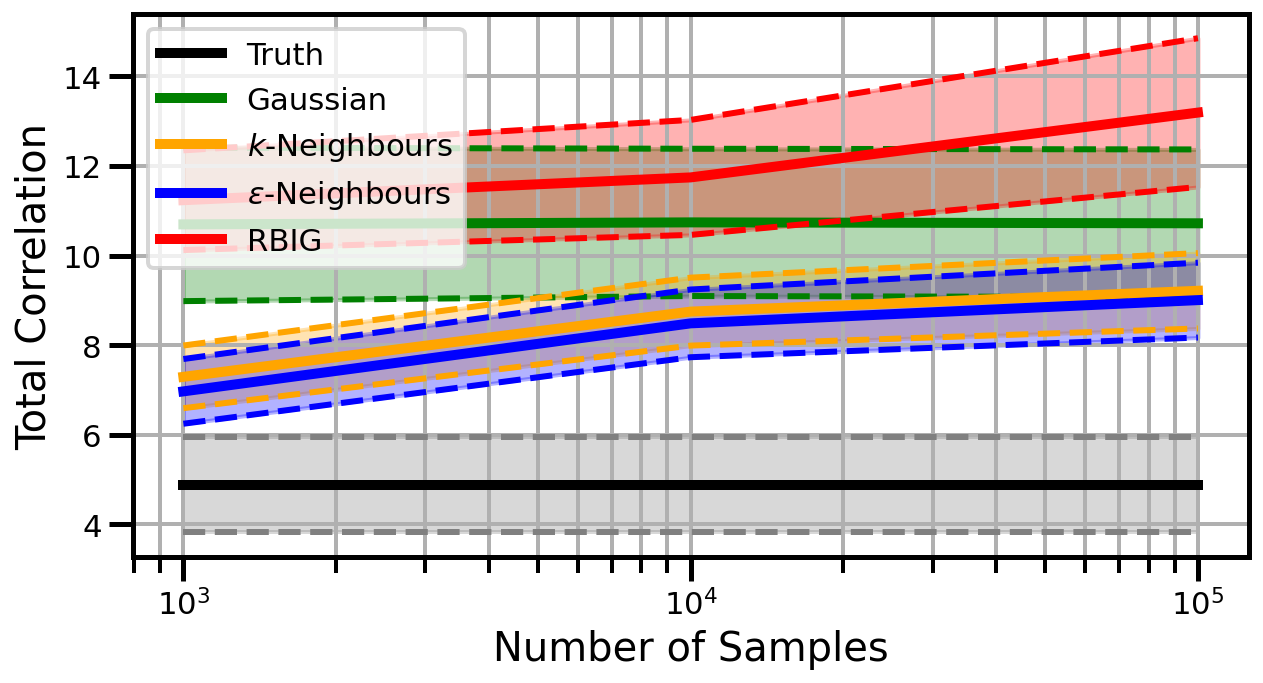
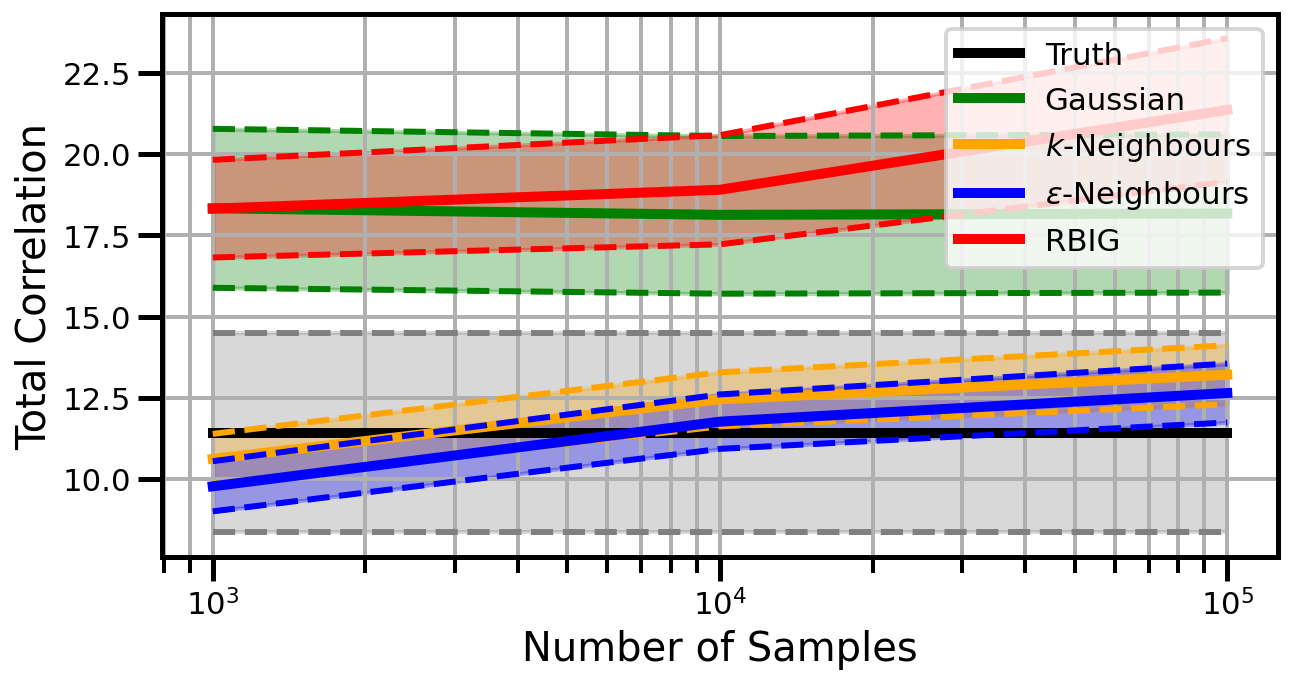
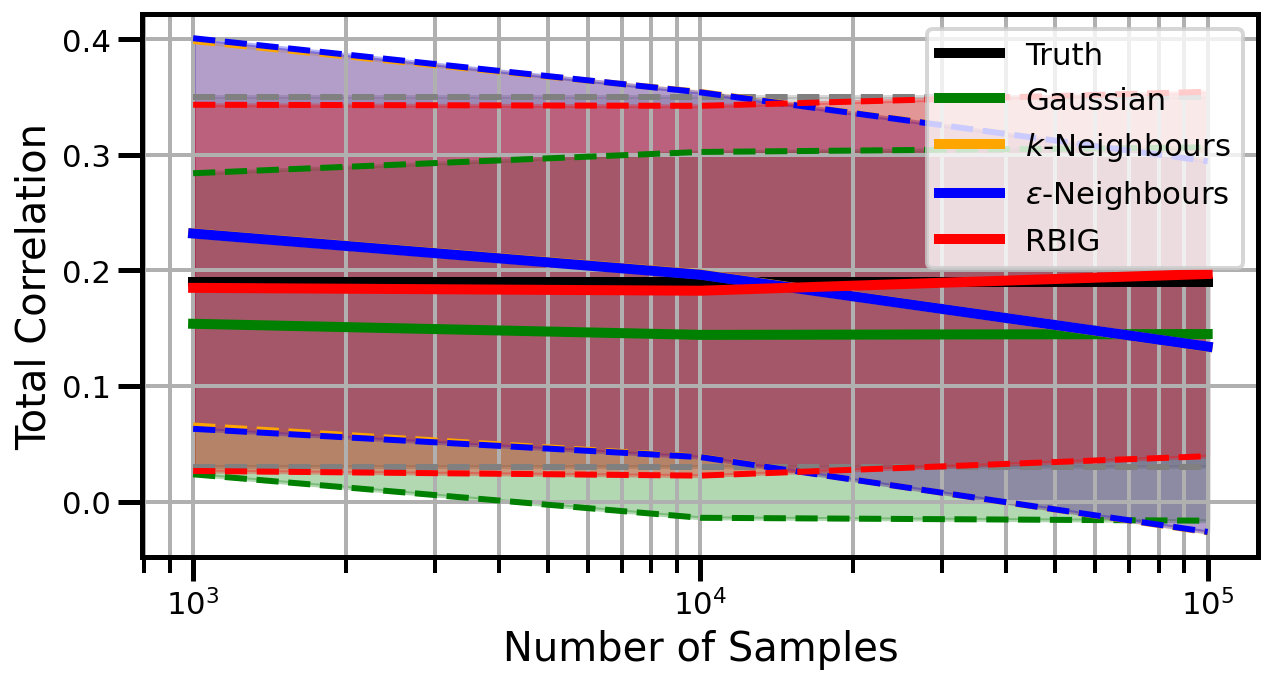
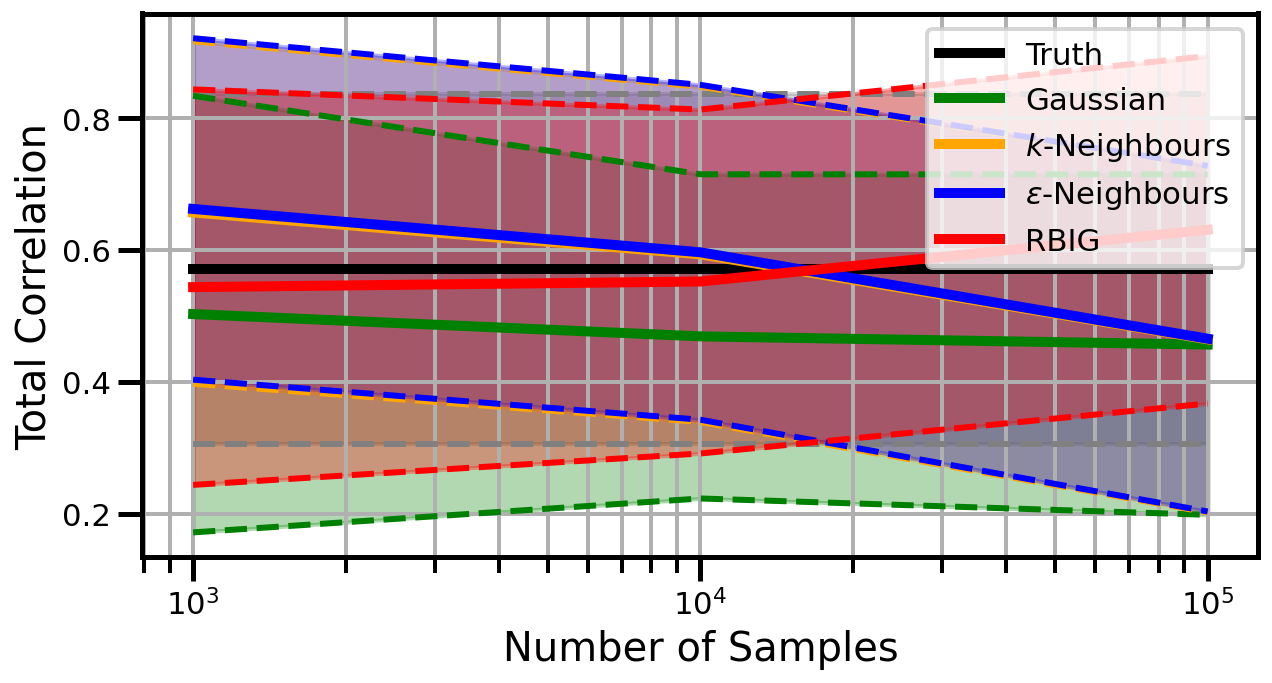
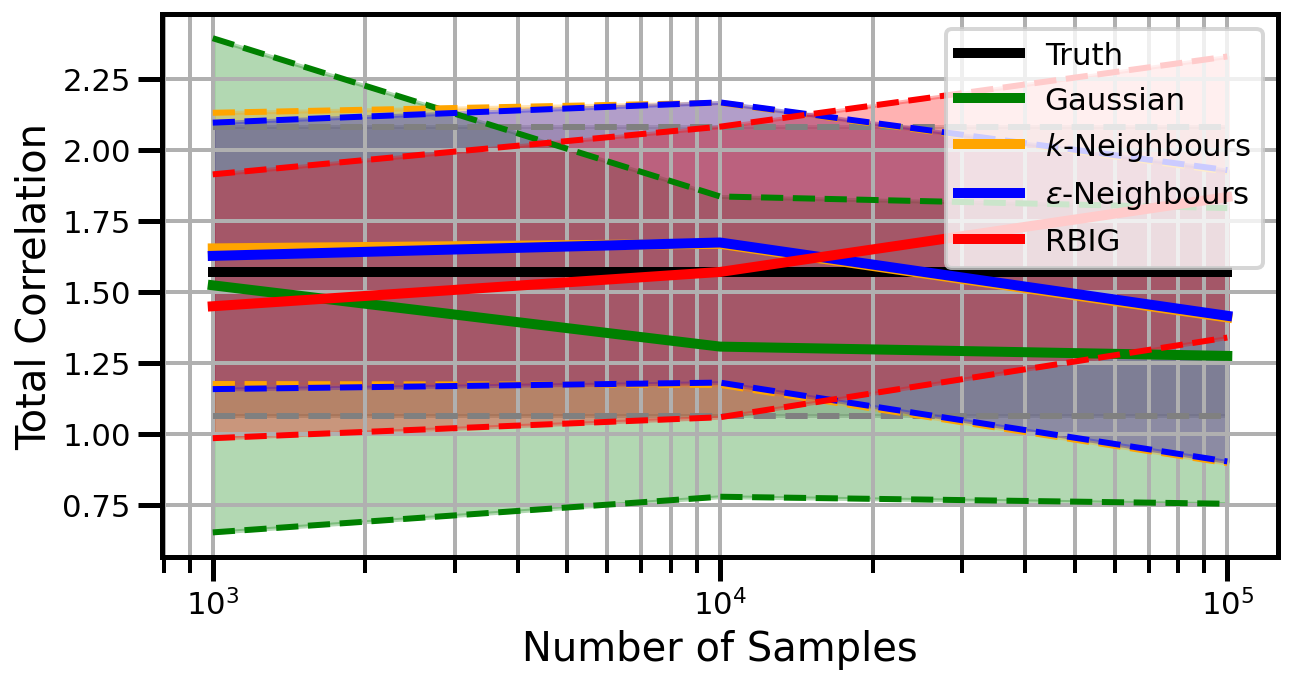
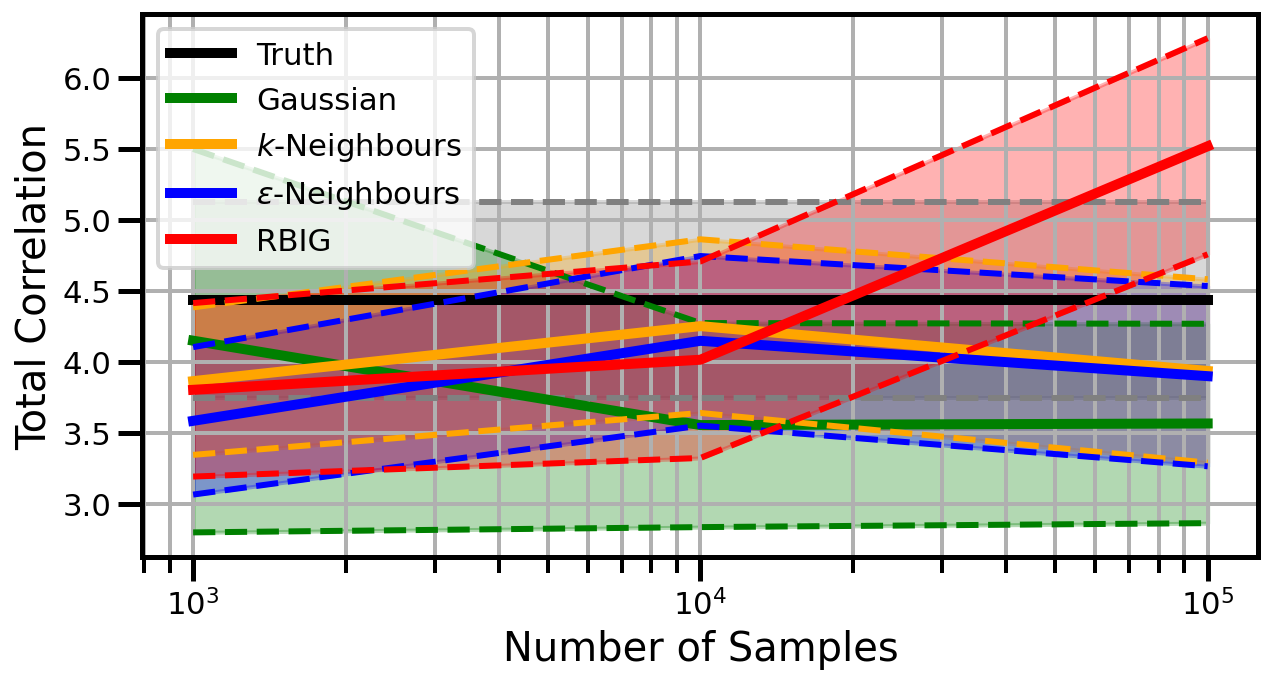
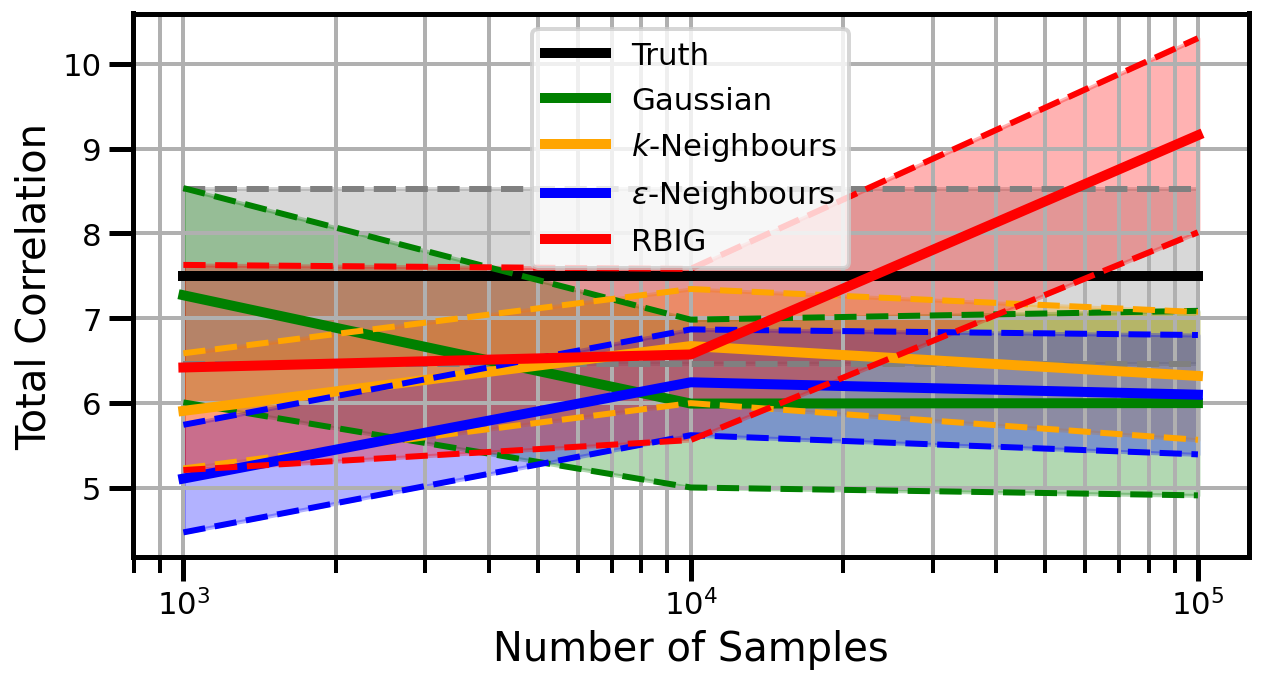
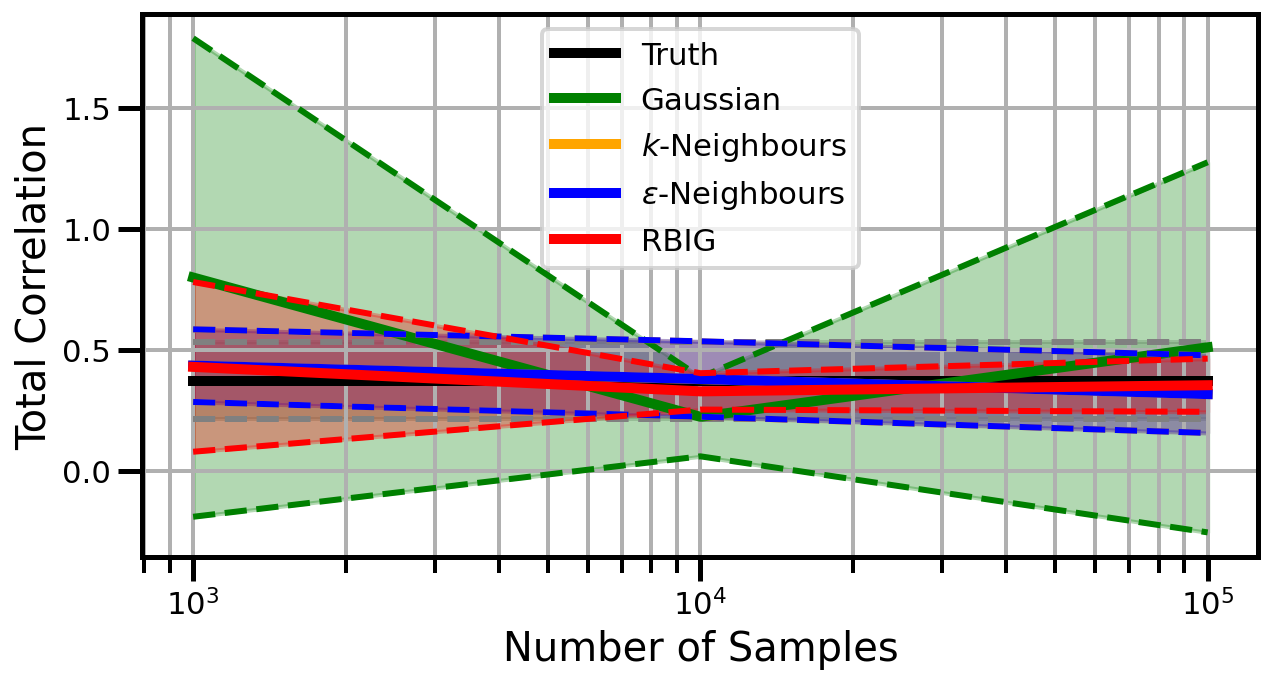
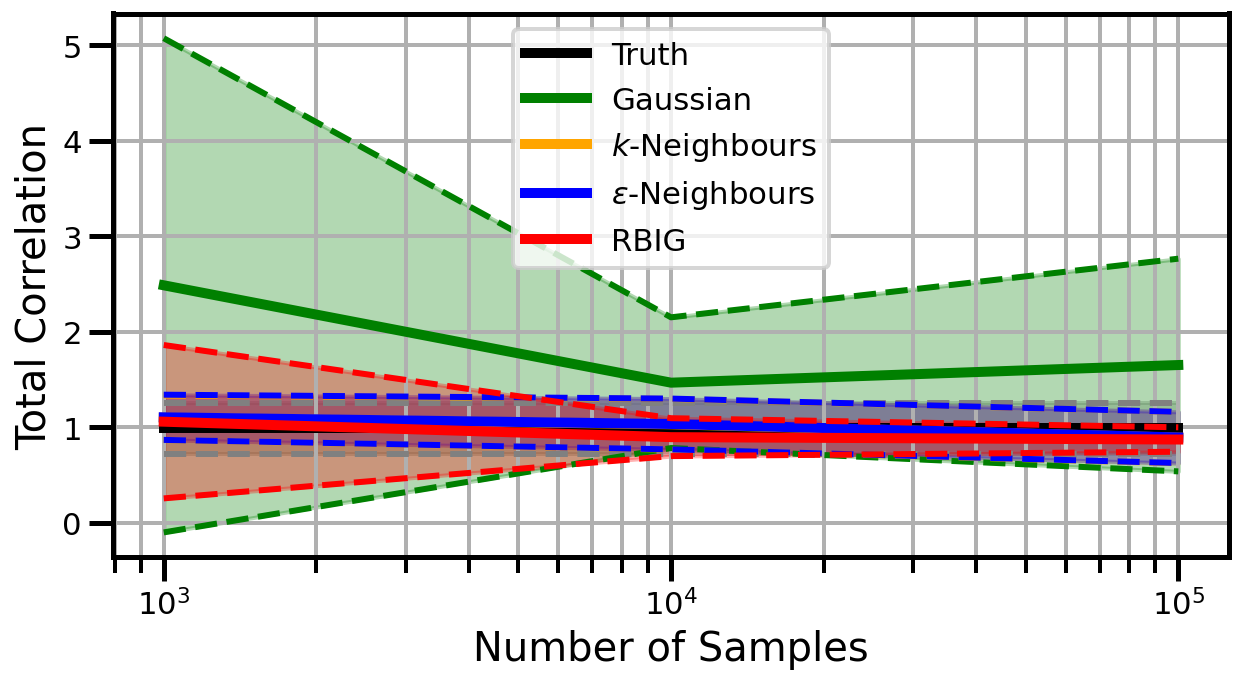
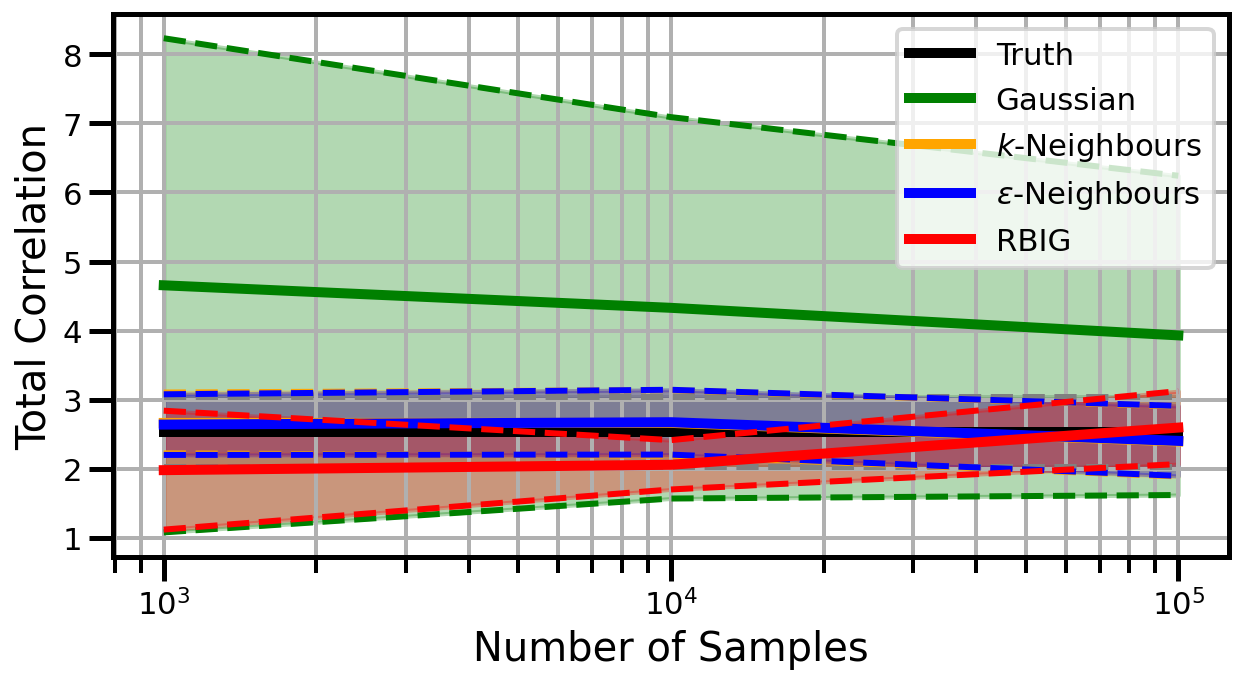
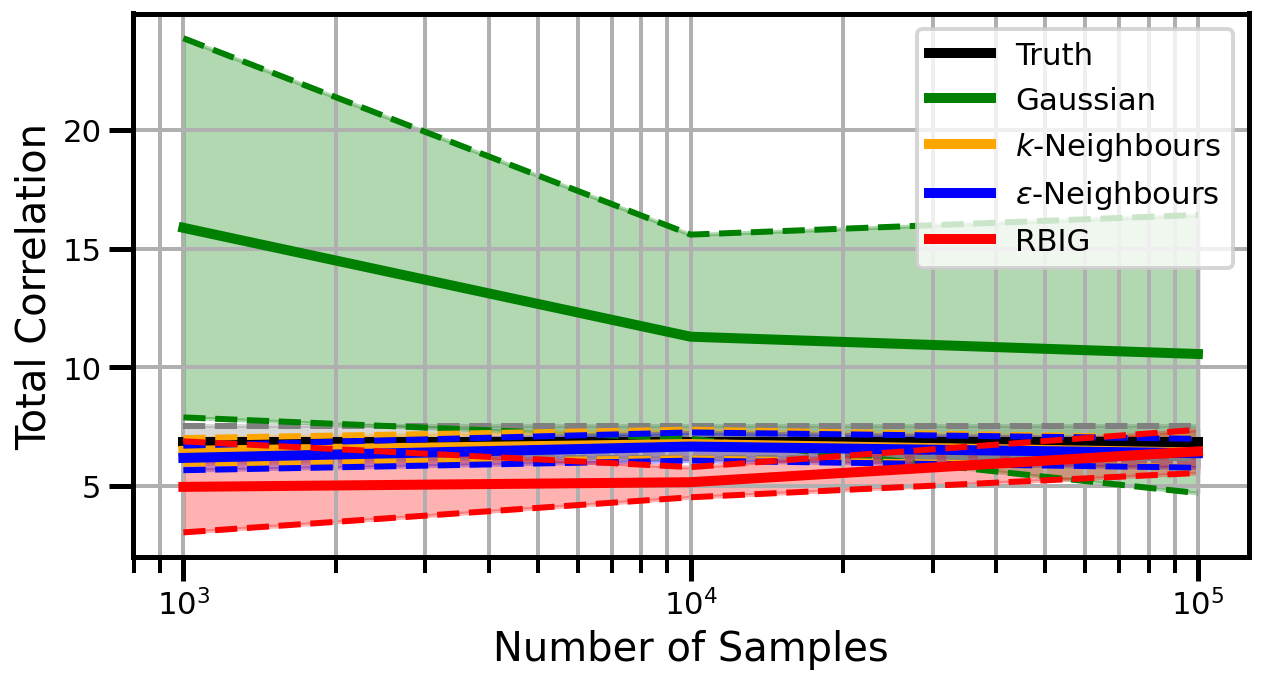
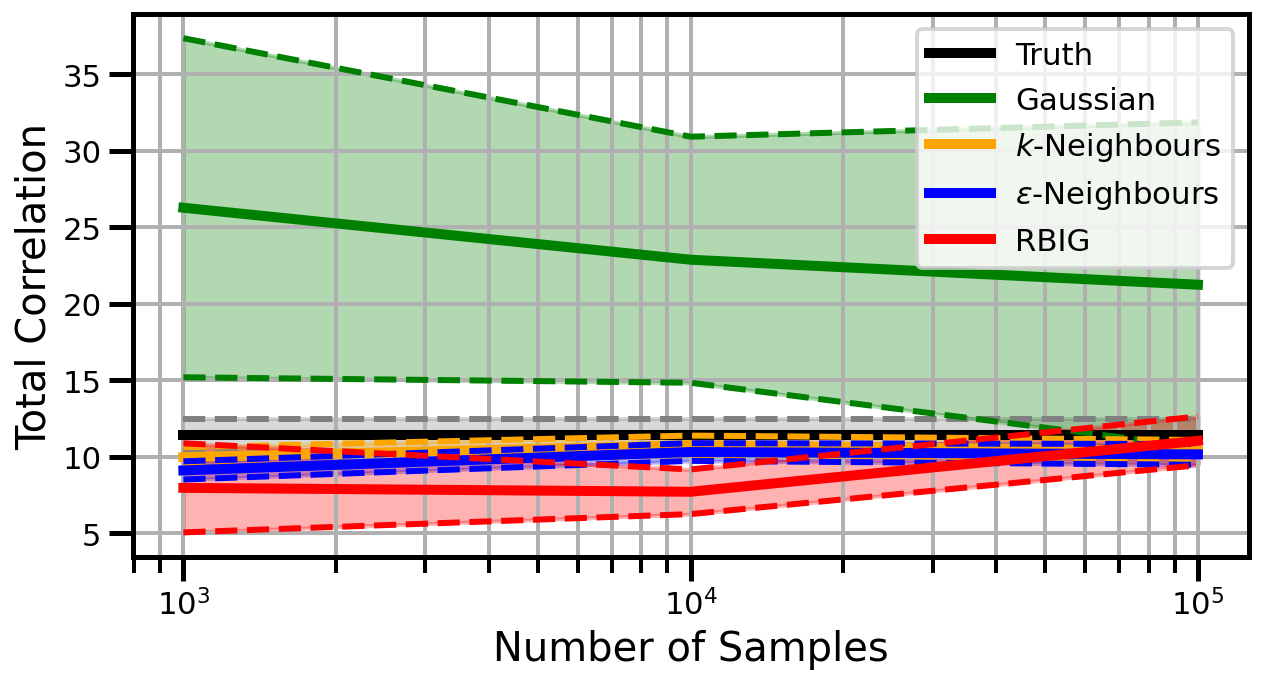
def plot_results(results_xr, dataset="gaussian", n_features=2):

    fig, ax = plt.subplots(figsize=(10, 5))

    # True
    mu, std = get_mu_std(
        results_xr.sel(model="gaussian", n_features=n_features, dataset=dataset).true
    )

    mu.plot.line(ax=ax, x="n_samples", color="Black", linewidth=5, label="Truth")
    ax.plot(mu.n_samples, mu.values + std.values, linestyle="--", color="gray")
    ax.plot(mu.n_samples, mu.values - std.values, linestyle="--", color="gray")
    ax.fill_between(
        mu.n_samples,
        mu.values - std.values,
        mu.values + std.values,
        alpha=0.3,
        color="gray",
    )

    # Gaussian Approximation
    mu, std = get_mu_std(
        results_xr.sel(model="gaussian", n_features=n_features, dataset=dataset).approx
    )

    mu.plot.line(
        ax=ax, x="n_samples", color="Green", linewidth=5, label=r"Gaussian",
    )
    ax.plot(mu.n_samples, mu.values + std.values, linestyle="--", color="green")
    ax.plot(mu.n_samples, mu.values - std.values, linestyle="--", color="green")
    ax.fill_between(
        mu.n_samples,
        mu.values - std.values,
        mu.values + std.values,
        alpha=0.3,
        color="green",
    )

    # KNN
    mu, std = get_mu_std(
        results_xr.sel(model="knn_nbs", n_features=n_features, dataset=dataset).approx
    )

    mu.plot.line(
        ax=ax, x="n_samples", linewidth=5, color="Orange", label=r"$k$-Neighbours"
    )
    ax.plot(mu.n_samples, mu.values + std.values, linestyle="--", color="orange")
    ax.plot(mu.n_samples, mu.values - std.values, linestyle="--", color="orange")
    ax.fill_between(
        mu.n_samples,
        mu.values - std.values,
        mu.values + std.values,
        alpha=0.3,
        color="orange",
    )
    # KNN (Epsilon)
    mu, std = get_mu_std(
        results_xr.sel(model="knn_eps", n_features=n_features, dataset=dataset).approx
    )

    mu.plot.line(
        ax=ax, x="n_samples", linewidth=5, color="Blue", label=r"$\epsilon$-Neighbours"
    )
    ax.plot(mu.n_samples, mu.values + std.values, linestyle="--", color="blue")
    ax.plot(mu.n_samples, mu.values - std.values, linestyle="--", color="blue")
    ax.fill_between(
        mu.n_samples,
        mu.values - std.values,
        mu.values + std.values,
        alpha=0.3,
        color="blue",
    )
    # RBIG
    mu, std = get_mu_std(
        results_xr.sel(model="rbig", n_features=n_features, dataset=dataset).approx
    )

    mu.plot.line(ax=ax, x="n_samples", linewidth=5, color="Red", label=r"RBIG")
    ax.plot(mu.n_samples, mu.values + std.values, linestyle="--", color="red")
    ax.plot(mu.n_samples, mu.values - std.values, linestyle="--", color="red")
    ax.fill_between(
        mu.n_samples,
        mu.values - std.values,
        mu.values + std.values,
        alpha=0.3,
        color="red",
    )
    ax.set_ylabel("Total Correlation", fontsize=20)
    ax.set_xlabel("Number of Samples", fontsize=20)
    ax.grid(which="both")
    ax.set_xscale("log")
    ax.set_title("")
    ax.legend()
    plt.gcf()
    wandb.log({f"consistency_{dataset}_{n_features}": wandb.Image(fig)})
    plt.show()
    plt.close(fig)
for idataset in datasets:

    print(idataset)
    for idims in [2, 3, 5, 10, 15]:
        print(f"Dimensions: {idims}")
        plot_results(results_xr, idataset, idims)
gaussian
Dimensions: 2
Dimensions: 3
Dimensions: 5
Dimensions: 10
Dimensions: 15
gaussian_rotation
Dimensions: 2
Dimensions: 3
Dimensions: 5
Dimensions: 10
Dimensions: 15
linear_rotation
Dimensions: 2
Dimensions: 3
Dimensions: 5
Dimensions: 10
Dimensions: 15
studentt
Dimensions: 2
Dimensions: 3
Dimensions: 5
Dimensions: 10
Dimensions: 15
cauchy
Dimensions: 2
Dimensions: 3
Dimensions: 5
Dimensions: 10
Dimensions: 15
Results#
Plot II - Sample Consistency#
def get_sample_tc(df, model, dataset="gaussian"):

    df = df[df["model"] == model]
    df = df[df["dataset"] == dataset]

    # get true values
    df_true = df["samples"]
    df_approx = df["approx"]

    return df_approx, df_true
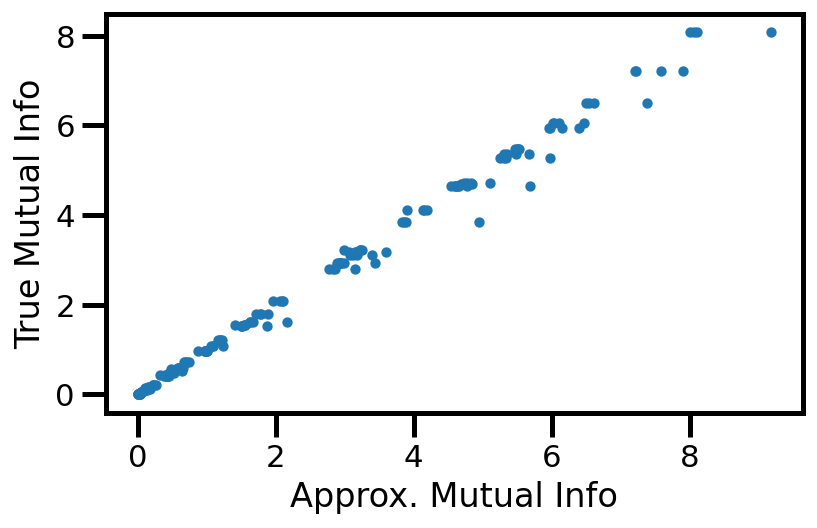
Plot I - Indiscriminate#
def get_mu_std(df, model, dataset="gaussian"):

    df = df[df["model"] == model]
    df = df[df["dataset"] == dataset]

    # get true values
    df_true = df["true"]
    df_approx = df["approx"]

    return df_approx, df_true
df_knn, df_true = get_mu_std(results_df, "gaussian")
fig, ax = plt.subplots()

ax.scatter(df_knn.values, df_true.values, s=10)
ax.set(xlabel="Approx. Mutual Info", ylabel="True Mutual Info")
plt.tight_layout()
plt.show()
# wandb.log({f"scatter_gaussian_pearson_dim": wandb.Image(fig)})
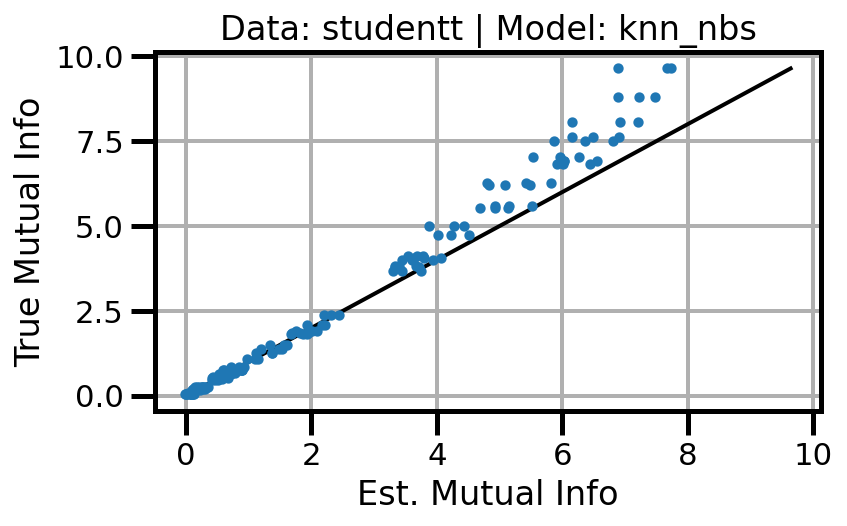
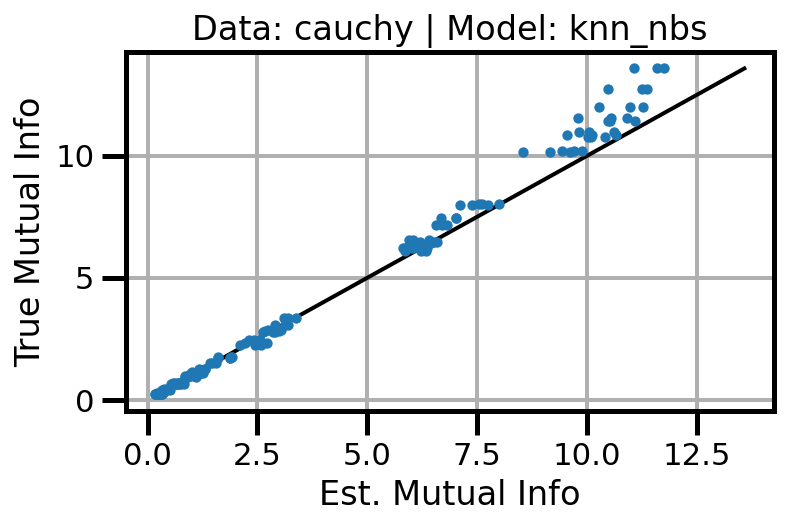
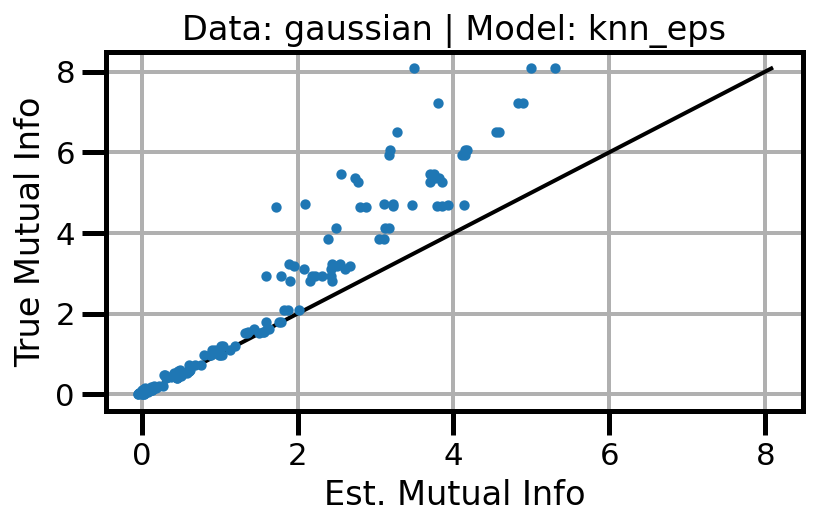
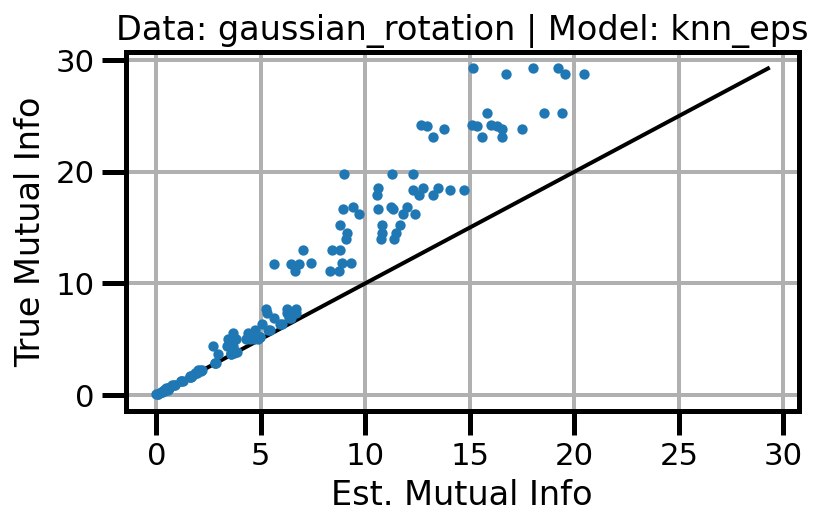
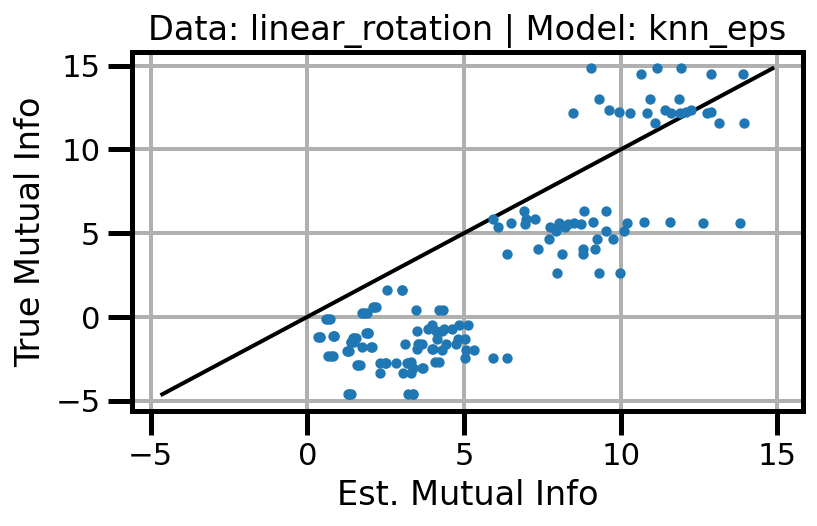
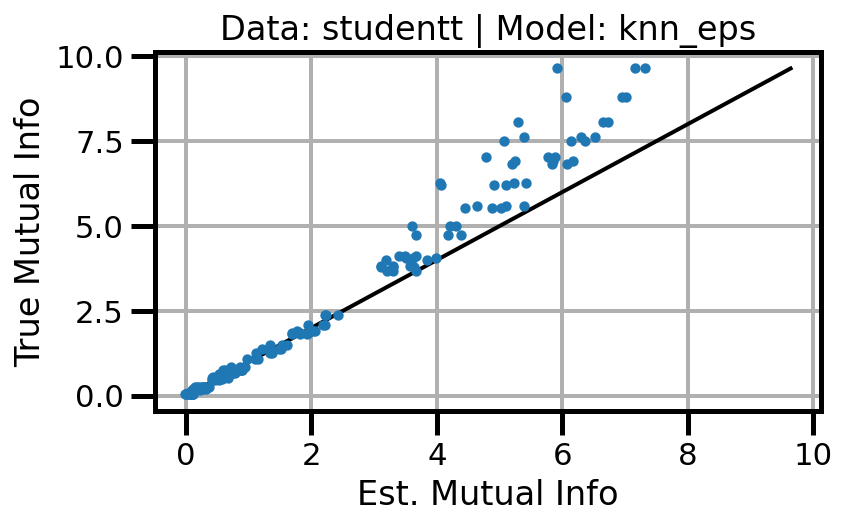
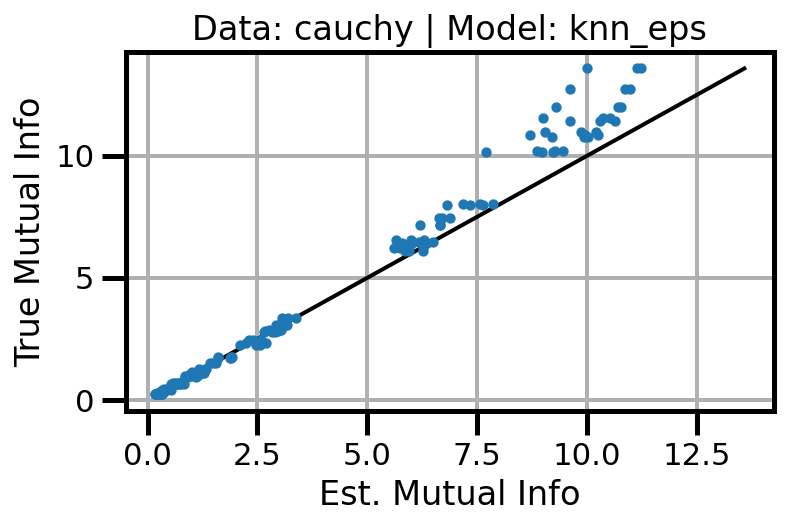
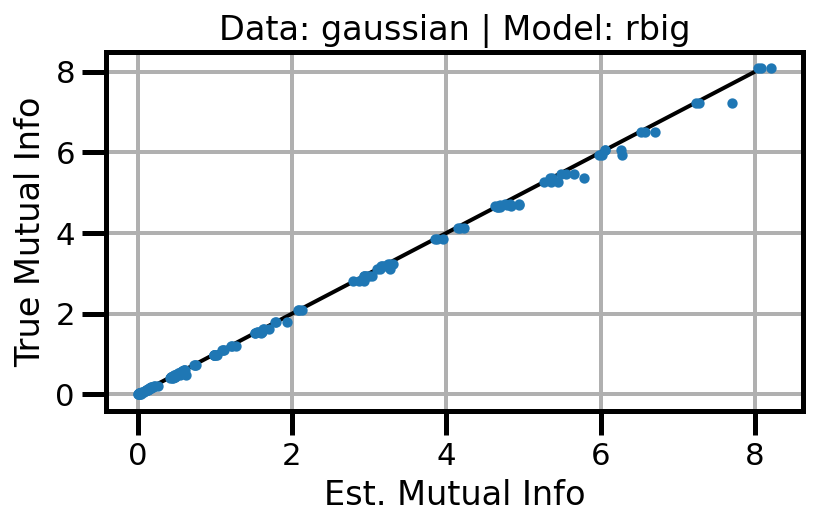
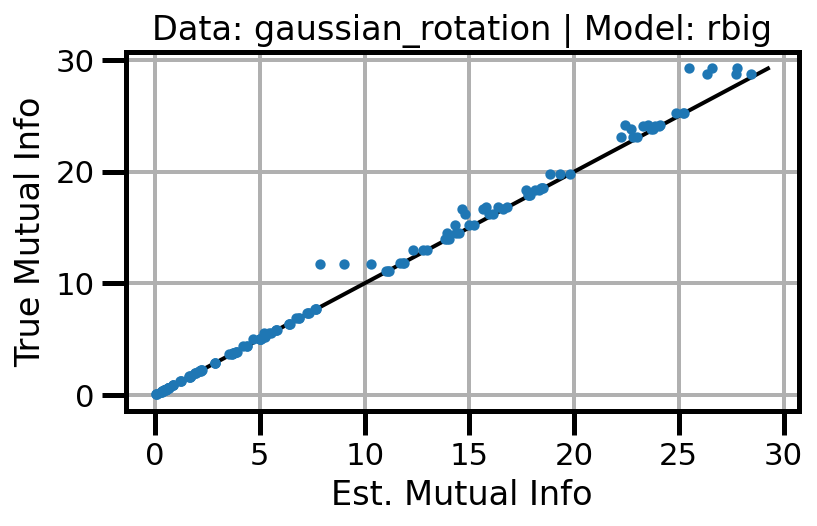
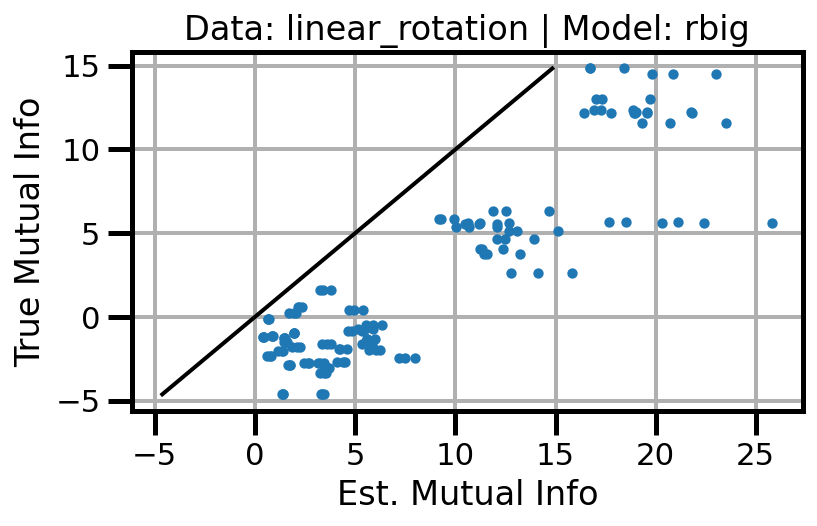
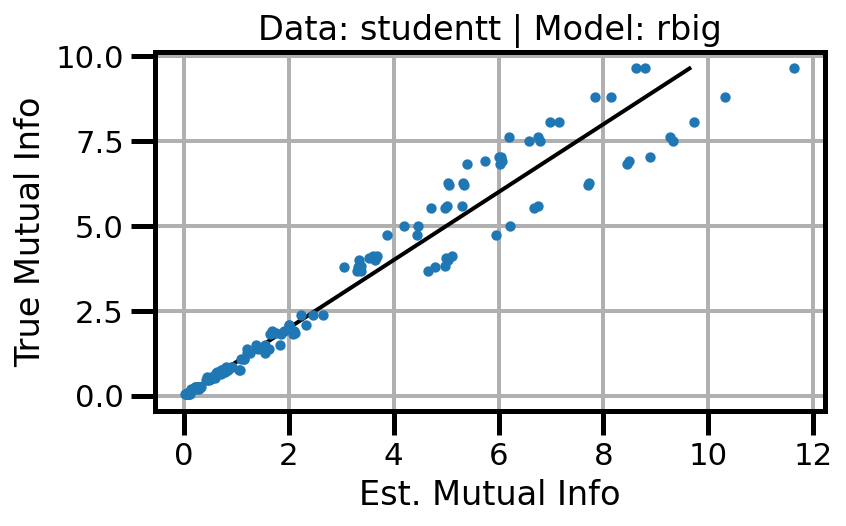
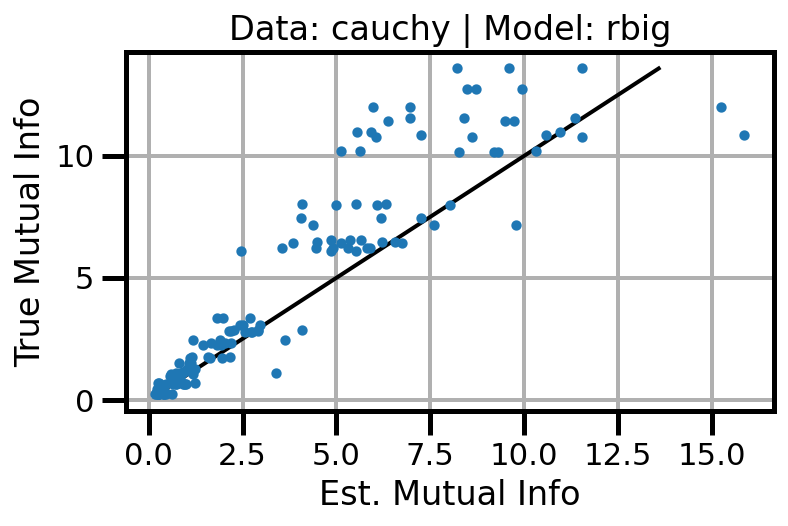
Results#
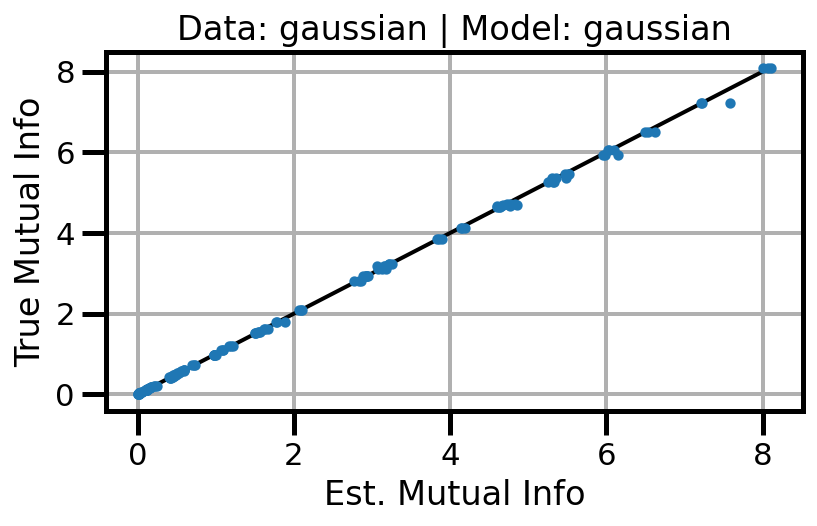
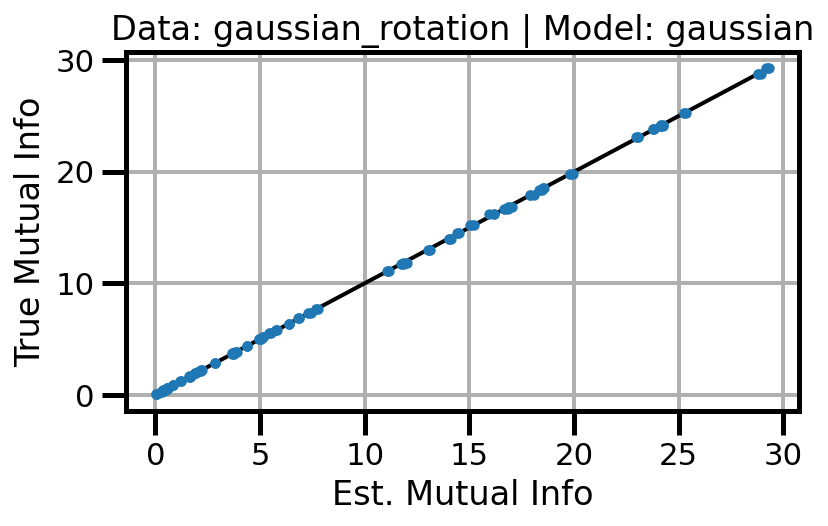
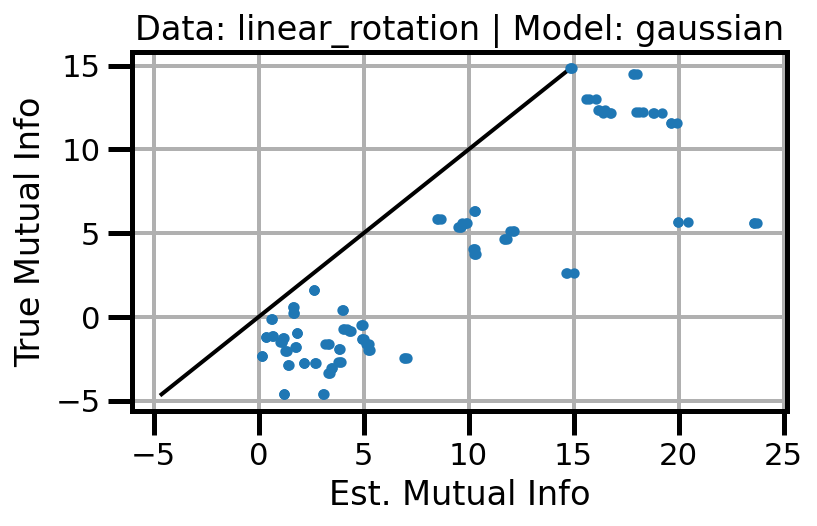
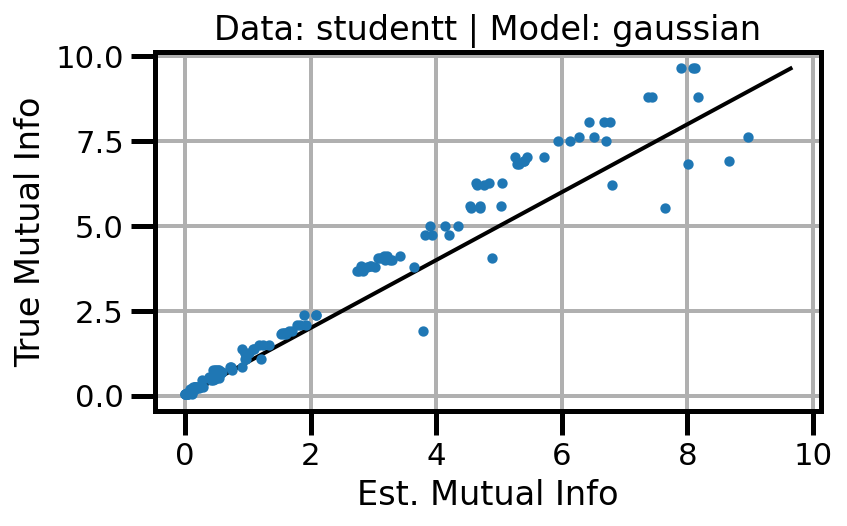
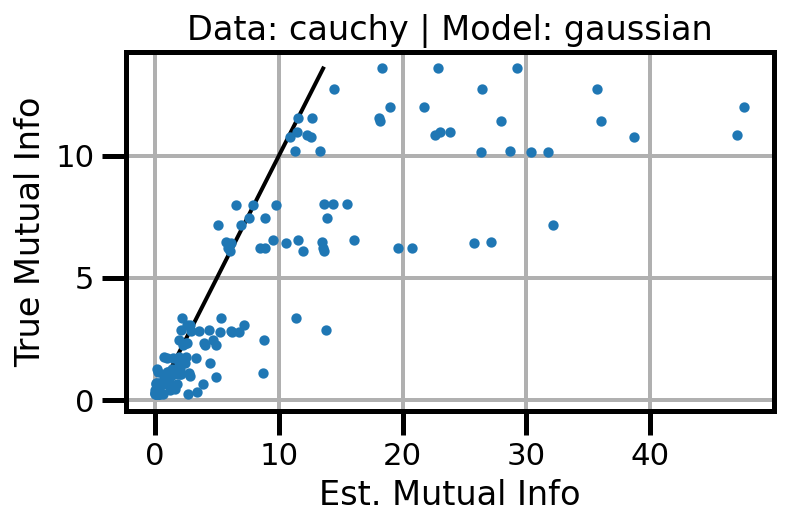
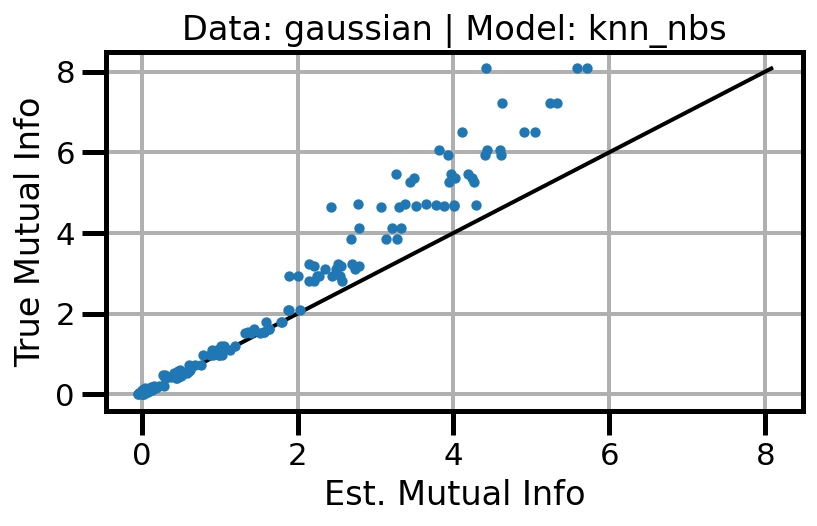
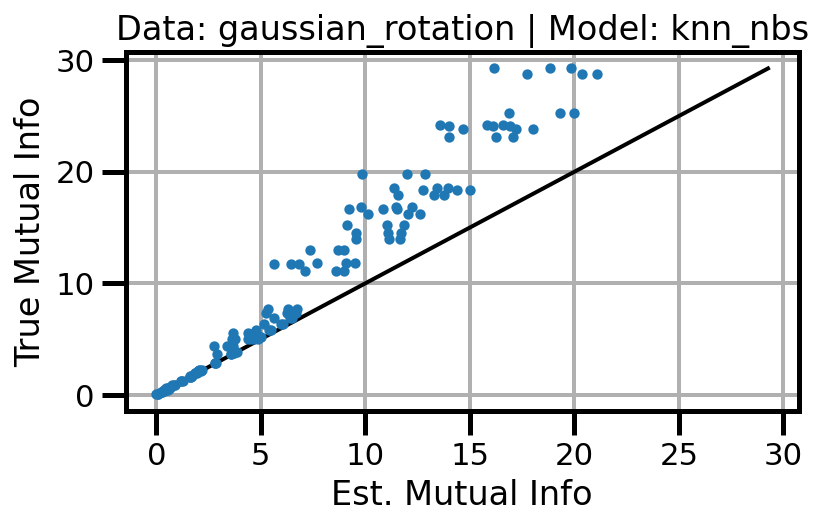
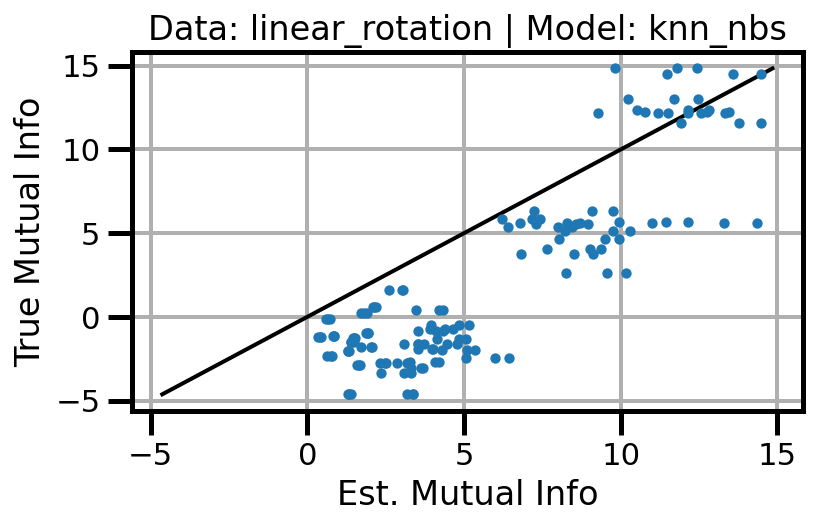
def plot_results(results_df, model="gaussian", dataset="gaussian"):

    results_df = results_df[results_df["n_samples"] != 100]

    df_approx, df_true = get_mu_std(results_df, model, dataset)

    min_val, max_val = df_true.min(), df_true.max()
    fig, ax = plt.subplots()

    ax.scatter(df_approx.values, df_true.values, s=10, zorder=3)
    ax.plot(
        [min_val, max_val],
        [min_val, max_val],
        color="black",
        linestyle="-",
        linewidth=2,
    )
    ax.set(xlabel="Est. Mutual Info", ylabel="True Mutual Info")
    ax.set_title(f"Data: {dataset} | Model: {model}")
    ax.grid()
    plt.tight_layout()
    plt.gcf()
    wandb.log({f"accuracy_{dataset}_{model}": wandb.Image(fig)})
    plt.show()
    plt.close(fig)
models = [
    "gaussian",
    "knn_nbs",
    "knn_eps",
    "rbig",
]

for imodel in models:
    for idataset in datasets:

        plot_results(results_df, model=imodel, dataset=idataset)